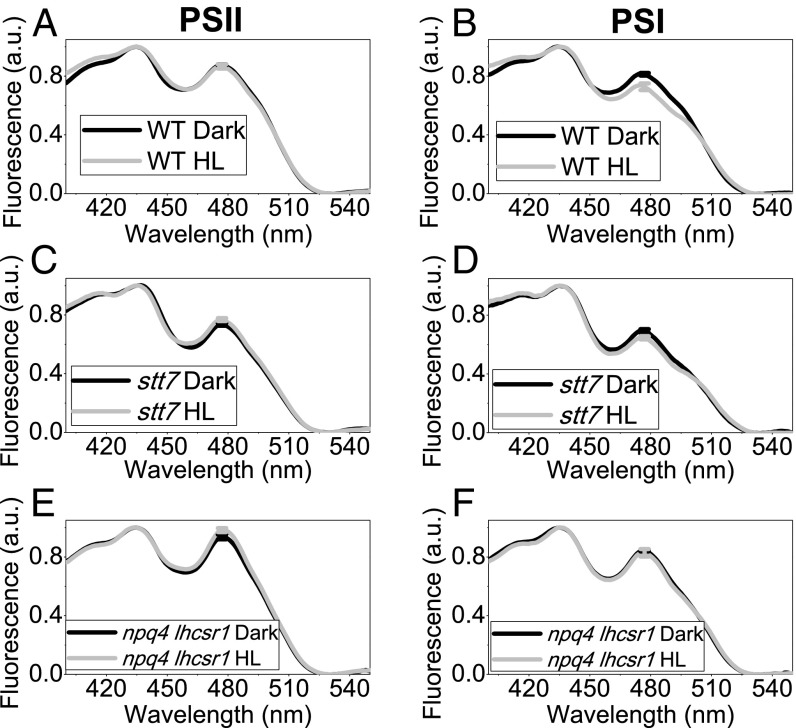
Fig. 5.
Here, 77 K fluorescence excitation spectra were recorded measuring fluorescence emission at 685 nm (A, C, E), where mainly PSII emits, and 710 nm (B, D, F), where mainly PSII emits. Fluorescence excitation spectra were measured in the case of dark-adapted (black) and HL treated (gray) WT (A, B) and stt7 (C, D) and npq4 lhcsr1 (E, F) mutant cells and normalized to the Chl a contribution at 436 nm. SDs are reported as error bars (n = 4).

