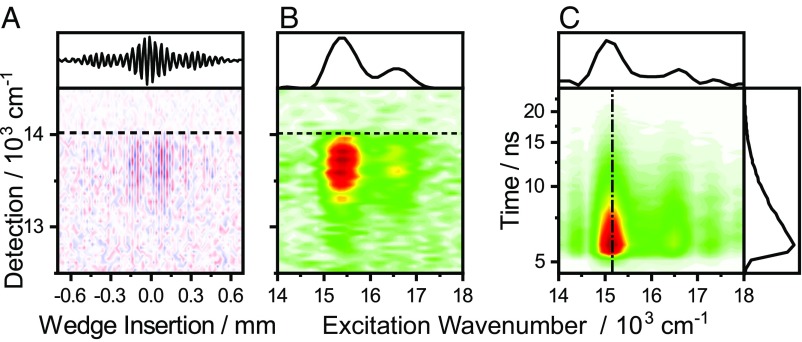
Fig. 2.
SM interferogram (A) and the corresponding SM EEM (B). Excitation spectra can be extracted by integrating the interferogram over the detection frequency (A, Top) followed by an FT, or by an FT to produce the EEM followed by integration over the detection frequency (B, Top). (B). The filter cutoffs are indicated by horizontal dashed lines. (C) Excitation-energy versus emission-intensity decay for an SM constructed from a interferometric TCSPC experiment.

