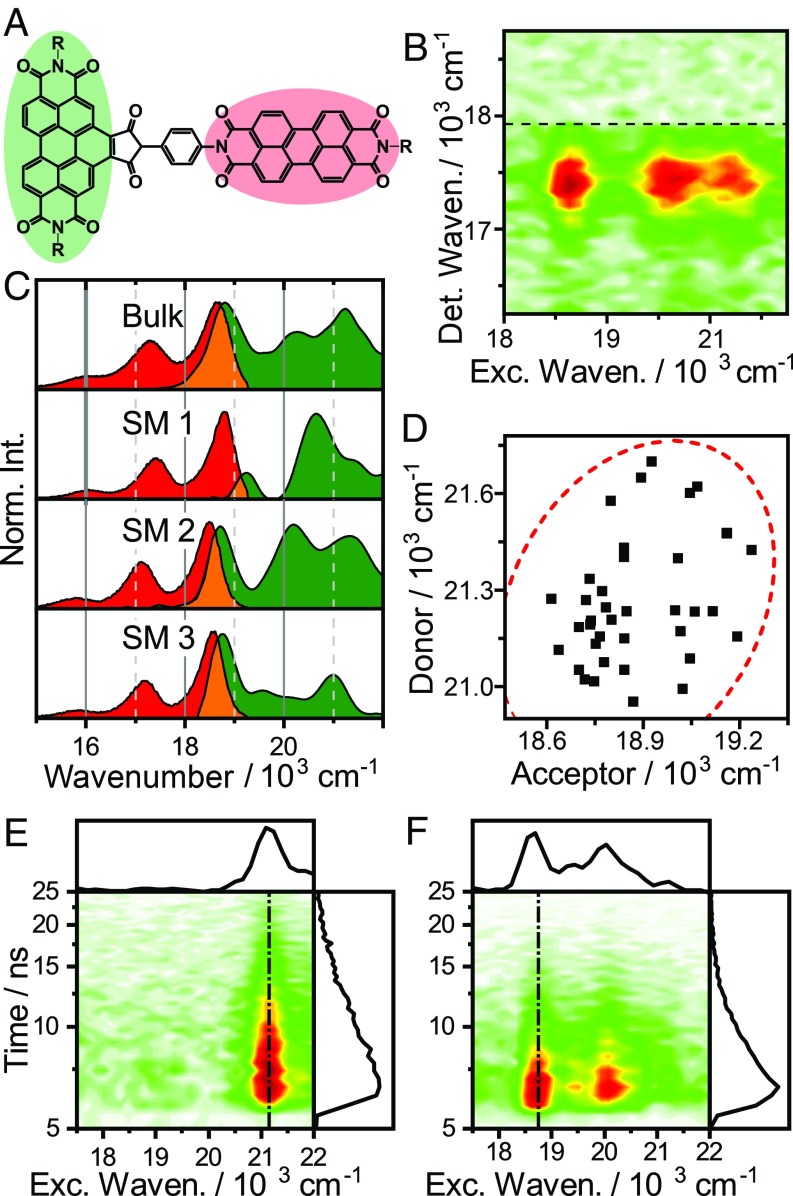
Fig. 5.
(A) Structure of the excitation-energy transfer donor–acceptor dyad. (B) EEM of a single dyad. (C) Comparison of excitation (green) and emission (red) spectra of several single dyads and the bulk spectra. (D) Correlation plot of donor- and acceptor frequencies in the dyads; 95% confidence ellipse shown as dashed red line. (E and F) Excitation versus emission intensity decay maps of two single dyads with different relative orientation to the polarization vector of the excitation light.

