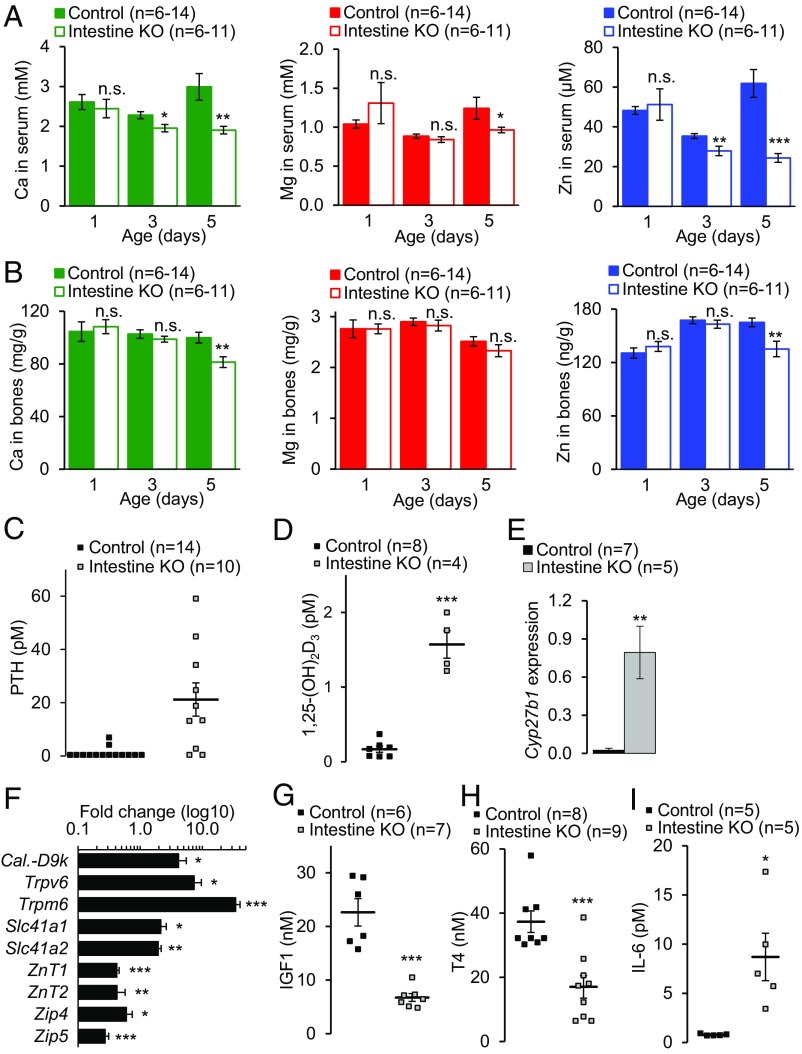
Fig. 4.
Analysis of Ca2+, Mg2+, and Zn2+ homeostasis in mice with intestine-restricted inactivation of Trpm7. (A and B) ICP-MS analysis of elementary levels of Ca (Left), Mg (Center), and Zn (Right) in serum (A) and bones (right tibia) (B) of P1, P3, and P5 Trpm7fl/fl (control) and Trpm7fl/fl;Villin1-Cre (intestine KO) littermates (n, number of mice examined per data point). In B total elementary contents were normalized to dry bone weights (mean ± SEM); n, number of mice per genotype. (C and D) P5 littermates were examined for circulating levels of PTH (C) and 1,25-(OH)2D3 (D) (mean ± SEM). Note that only two control samples contained PTH levels in the range of ELISA sensitivity, and statistical analysis could not be conducted. (E) Relative expression levels (mean ± SEM) of Cyp27b1 in mRNA extracts from whole kidneys of P5 littermates were studied using qPCR and Ywhaz as a reference transcript. (F) Relative expression levels of indicated transcripts were investigated in mRNA extracts from whole duodenums of P5 littermates using qPCR and Hprt as a reference transcript. Results are calculated as fold change (mean ± SEM) in Trpm7fl/fl;Villin1-Cre (n = 8–12) mice vs. Trpm7fl/fl (n = 7–12) mice. (G–I) P5 littermates were assessed for circulating levels of IGF1 (G), T4 (H), and IL-6 (I) (mean ± SEM). ***P ≤ 0.001; **P ≤ 0.01; *P ≤ 0.05; n.s., not significant (Student’s t test); n, number of mice examined.

