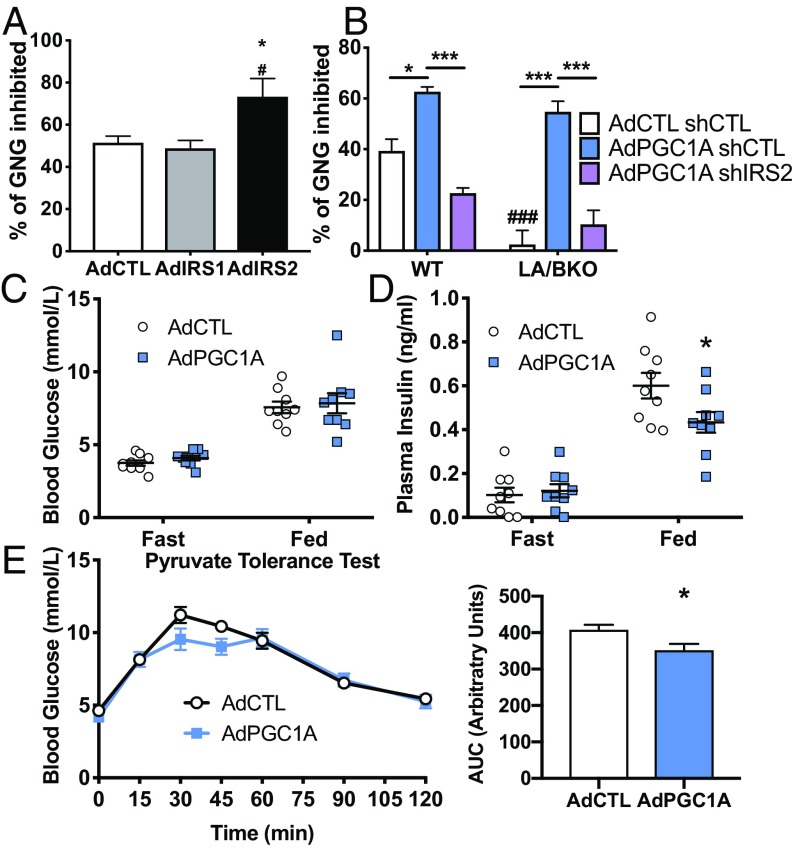
Fig. 5.
Insulin-induced suppression of hepatocyte gluconeogenesis is regulated by the PGC1A/IRS2 axis in vitro and in vivo. (A) Insulin-mediated (100 nM, 1 h) suppression of glucagon-induced (1 nM, 1 h) gluconeogenesis (GNG) in primary hepatocytes overexpressing vector, IRS1, or IRS2 (n = 8 ± SEM). *P < 0.05 vs. Control; #P < 0.05 IRS2 vs. IRS1. (B) Insulin suppression of GNG in WT and LA/BKO hepatocytes expressing control or PGC1A and shControl or shIRS2, as indicated (n = 4 ± SEM). ###P < 0.001 vs. WT; *P < 0.05, ***P < 0.001. Male mice tail-vein–injected with viruses encoding vector (AdCTL) or PGC1A (AdPGC1A). Blood glucose (C) and plasma insulin (D) measured after 16 h fasting or 1 h refeeding. (E) Pyruvate tolerance test and area under the curve (Right). n = 9 ± SEM; *P < 0.05 vs. control. All experiments were performed twice.

