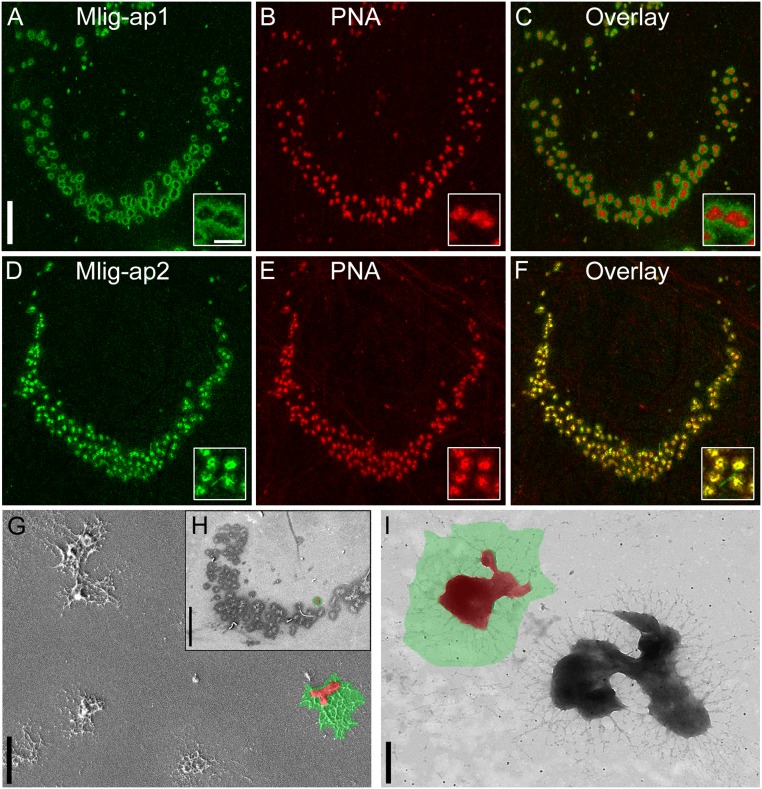
Fig. 2.
Spatial distribution of Mlig-ap1 and Mlig-ap2 on M. lignano footprints. (A–C) Confocal projection of double labeling of footprint with antibody against Mlig-ap1 and lectin PNA. (D–F) Confocal projection of double labeling of footprint with antibody against Mlig-ap2 and lectin PNA. (G and H) Scanning electron microscopy pictures of single adhesive organ footprints in detail (G) and a whole tail-plate footprint (H), false-colored: Mlig-ap1 is indicated in green, and Mlig-ap2 is in red. (I) Transmission electron microscopy picture of two single adhesive organ footprints, false-colored: area of distribution of Mlig-ap1 (green) and Mlig-ap2 (red). For comparison with a footprint lacking Mlig-ap1, see Fig. 5B. [Scale bars, 20 µm (A and H), 2 µm (G), and 500 nm (A, Inset and I).]

