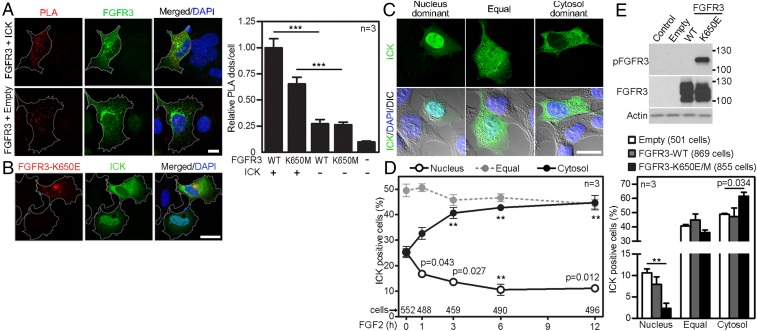
Fig. 4.
FGF signaling alters ICK’s subcellular distribution. (A) 293T cells were transfected with FLAG-tagged ICK together with V5-tagged wild-type FGFR3 or its active mutant K650M. The antibodies against protein tags were used in the PLA (red); FGFR3 antibody was used to counterstain the transfected cells (green). As a negative control, cells were transfected with FGFR3 and an empty vector. Numbers of PLA dots per cell were calculated and plotted (Student’s t test, ***P < 0.001). (Scale bar, 10 µm.) (B) Increased cytosolic localization of transfected ICK in a 293T cell cotransfected with FGFR3-K650E, determined by ICK and FGFR3 immunocytochemistry (Scale bar, 20 µm.). (C and D) Altered ICK subcellular distribution in 293T cells expressing FLAG-tagged ICK, treated with FGF2; ICK was visualized by FLAG immunocytochemistry. (C) Typical localization patterns of ICK (DIC, differential interference contrast). (Scale bar, 20 µm.) (D) Percentages of cells in each category of ICK localization (Student’s t test, **P < 0.01). (E) 293T cells were transfected with FLAG-tagged wild-type FGFR3, active FGFR3-K650E, or K650M, or empty vector, and immunoblotted for phosphorylated (p) FGFR3. ICK and FGFR3 were visualized by immunocytochemistry, and ICK subcellular localization was determined.

