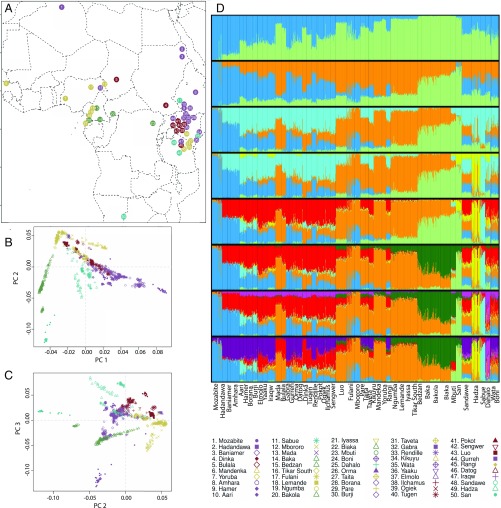
Fig. 1.
Geographic distribution of populations studied and summaries of population structure. (A) The geographic distribution of populations included in the study presented on a map of Africa. The legend indicates the colors assigned to each language family and the number and unique combination of color and symbol for each ethno-linguistic population. (B) PCA was performed using individuals’ genotypes; PC1, which explains 2.11% of the genotypic variance and shows a North–South cline, was plotted against PC2, which explains 0.91% of the genotypic variance and separates individuals with NC ancestry. (C) Hadza and Sabue individuals cluster at one extreme end of PC3, which explains 0.73% of variance in individuals’ genotypes; NS-speaking individuals are also found clustering near the Hadza and Sabue. (D) Population structure was inferred using the STRUCTURE software using 20,000 unlinked loci; results are shown from K = 2 to K = 9, the latter of which was identified as having the best, most stable fit to the data. The STRUCTURE analysis revealed K = 9 AAC. Supporting the PCA, two AAC’s corresponded to NC ancestry (orange); that is, correlated with the Bantu expansion, and North African ancestry (blue). In addition, the other AACs identify structure between HG populations: San (light green), WRHG (dark green), Hadza (yellow), Dahalo (light purple), and Sabue (light blue). Results from K = 2 to K = 8 are discussed in SI Appendix.

