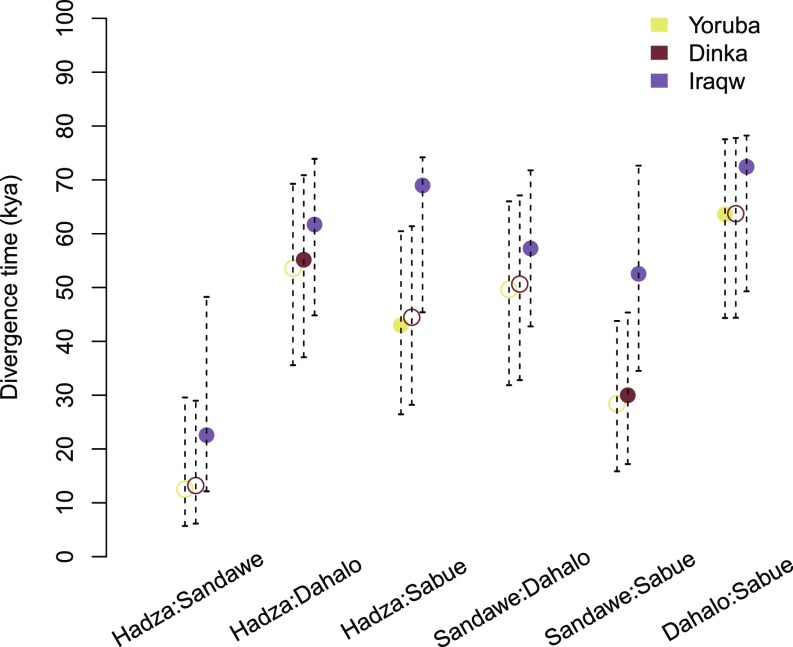
Fig. 3.
Divergence time estimates. The maximum a posteriori estimates and 95% credible intervals for pairwise divergence time estimates are displayed for each set of population samples. Estimates incorporated shared gene flow with the Yoruba, Iraqw, and Dinka, representing NC, AA, and NS source populations, and are color-coded as yellow, purple, and red, respectively. The closed circles represent population combinations for which we believe the included source population likely contributed migrants to either HG population in the past.

