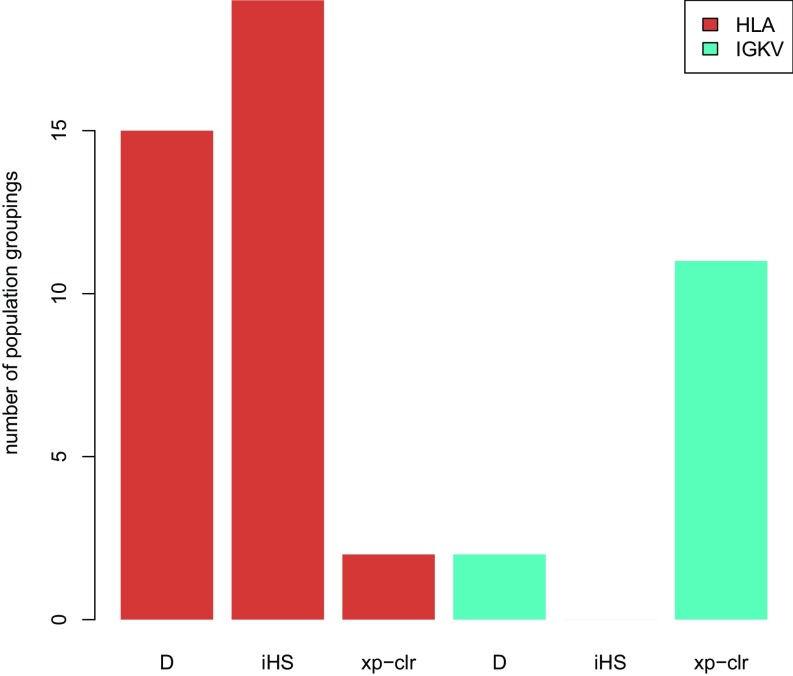
Fig. 4.
Signatures of selection shared among population groupings. These shared signals among population groupings include candidate loci in the top 0.01% of the empirical distribution of each neutrality test statistic (D, iHS, XP-CLR, respectively). The HLA and IGKV gene families are displayed along the x axis for each neutrality test. The y axis displays the number of population groupings that share signatures of selection at these loci.

