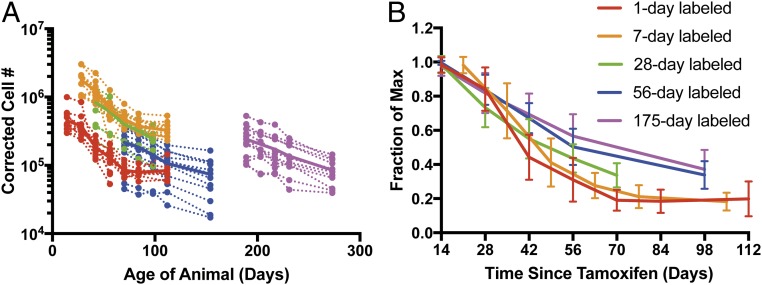
Fig. 2.
Dynamics of timestamped CD8+ T cells with age. (A) Corrected cell numbers of stamped CD8+ T cells based on the percentage of labeled cells in blood. Dashed lines depict trajectories of individual animals (n = 12–17 per group), while the solid lines represent the arithmetic mean trajectory for each age group. (B) Survival of CD8+ T cells based on time since production. The fraction of the maximum labeled CD8+ T cells that persist at different times after tamoxifen administration (error bars represent SD from each group). The rate of decay of labeled CD8+ T cells is not constant with age but rather it is decreasing with the age at stamping.

