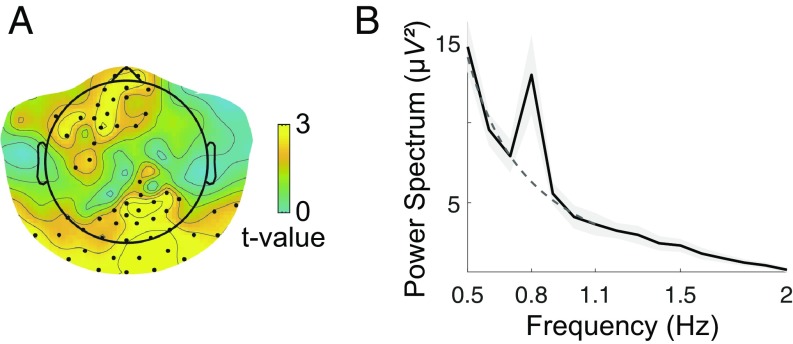
Fig. 2.
FTR, all conditions merged. (A) Statistical map (one-tailed t test, corrected) of the difference between the power spectrum at the tag frequency (0.8 Hz) and the background power at the same frequency, estimated by a power-law fit of the power spectrum from the six neighboring frequency bins (±0.3 Hz). Electrodes belonging to a statistically significant cluster are marked with a black dot. Two clusters emerge: a posterior one (Pcorr < 0.003) and a frontal one (Pcorr < 0.022). (B) Power spectrum averaged over electrodes belonging to the posterior cluster (with P < 0.01) (black line) ± SEM (gray shadow) across subjects: although the overall frequency profile is well described by a power law (dashed dark-gray line, fitted in the interval 0.5 to 1.1 Hz), a peak neatly emerges at the tag frequency.

