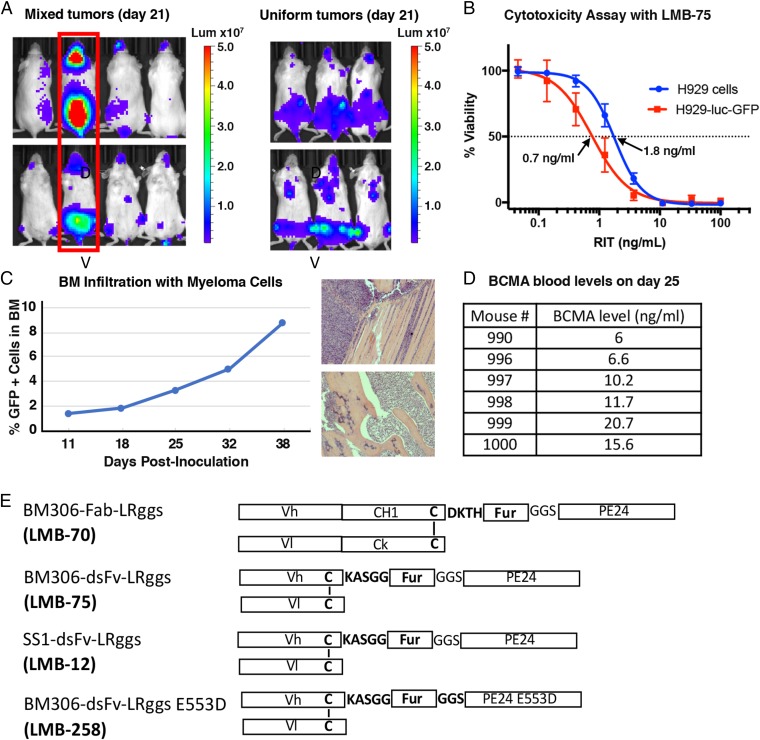
Fig. 1.
Generation of the H929 BM mouse model. (A) Growth of H929-luc-GFP cells in NSG mice. H929-luc-GFP cells were injected IV into four NSG mice, resulting in nonuniform tumor growth among the mice, based on bioluminescence imaging 21 d after tumor inoculation (Left). The mouse with the highest tumor burden (encircled in red) was killed, and BM cells were harvested from its spine and femurs. These recovered cells were used to inoculate tumors IV in three NSG mice. The bioluminescence images of these mice demonstrate uniform tumor growth at day 21 (Right). Dorsal (D) and ventral (V) images are shown for each mouse. (B) Recovered H929-luc-GFP cells are sensitive to LMB-75. Representative WST8 assay of the original H929 cell line compared with the luciferase transfected cells that were recovered from the mouse in A (abbreviated H929-luc-GFP). (C) BM infiltration of H929-luc-GFP cells. The mice bearing H929 tumors were killed, and the femurs harvested for BM cell isolation on days 11, 18, 25, 32, and 38. BM cells were sorted by flow cytometry for GFP+ cells on these days, indicating that the percentage of myeloma cells in the femurs at the time points listed were 1.4, 1.8, 3.3, 5.0, and 8.8, respectively (Left). Histological analysis (Right) of H929 mice on day 38 demonstrates infiltration of the femur (Top) and hind limb (Bottom) with myeloma cells. Invading tumor cells marked by asterisks. (D) H929-tumor bearing mice shed the BCMA in the serum. Soluble BCMA levels were measured from the sera of H929-tumor bearing mice at day 25 by BCMA-detection ELISA. The BCMA levels ranged from 6 to 21 ng/mL. (E) Schematics of various immunotoxins used in this paper. BM306 Fab RIT (LMB-70), BM306 dsFv RIT (LMB-75), SS1 dsFv RIT (LMB-12), and BM306 dsFv with an E553D mutation in PE24 (LMB-258).

