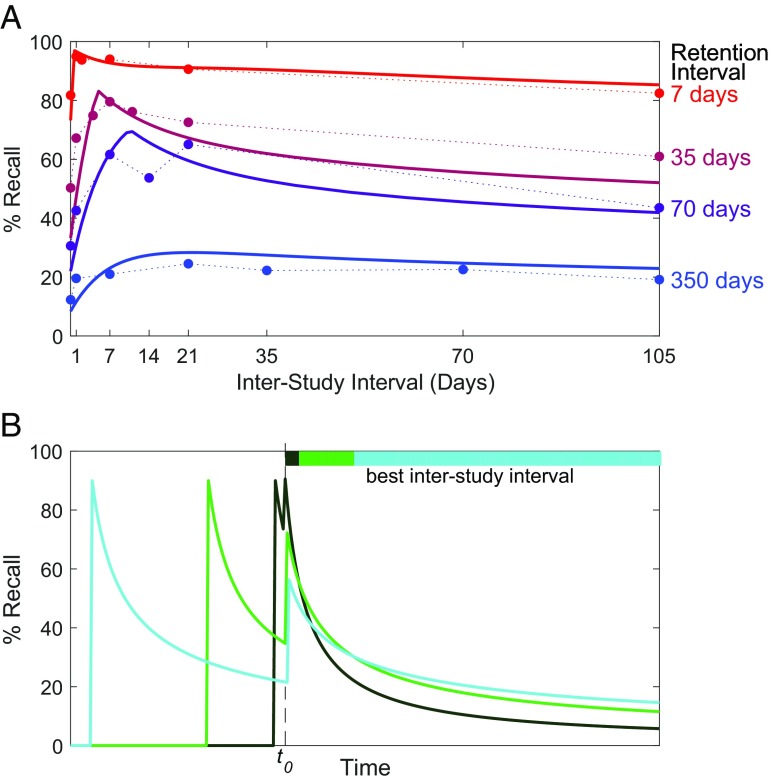
Fig. 1.
(A) Recall accuracy at test for a given RI (7, 35, 70, or 350 d), after the learner has studied material over two sessions separated by a given ISI ( to 105 d). Data points are from a human behavioral experiment (18). Solid lines are predictions of a cognitive model fit with one free parameter to the data (10). (B) Hypothetical memory strength curves consistent with experimental results in A. Each curve shows a sequence of two study sessions, aligned such that the second session of each sequence occurs at time (dashed line). For various (i.e., the RI ) the bars at the top of the graph indicate which ISI achieves the highest recall accuracy. The optimal spacing depends on the RI.

