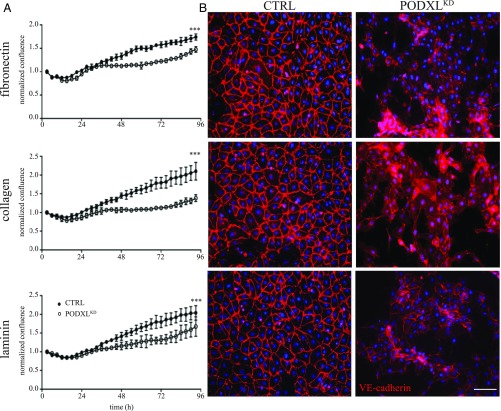
Fig. 1.
Podxl promotes HUVEC monolayer formation. (A) Confluence normalized to starting concentration as measured by the IncuCyte ZOOM confluence processing analysis tool (basic analyzer). WT and PODXLKD HUVEC monolayers measured over 96 h. Error bars represent SD (n = 3). ***Significantly less confluent than WT with P < 0.001 (determined by Student’s t test). (B) VE-cadherin staining (red) of WT and PODXLKD HUVECs at 48 h after seeding cells on the indicated matrix. DAPI (nuclear stain). (Scale bars: 100 µm.)

