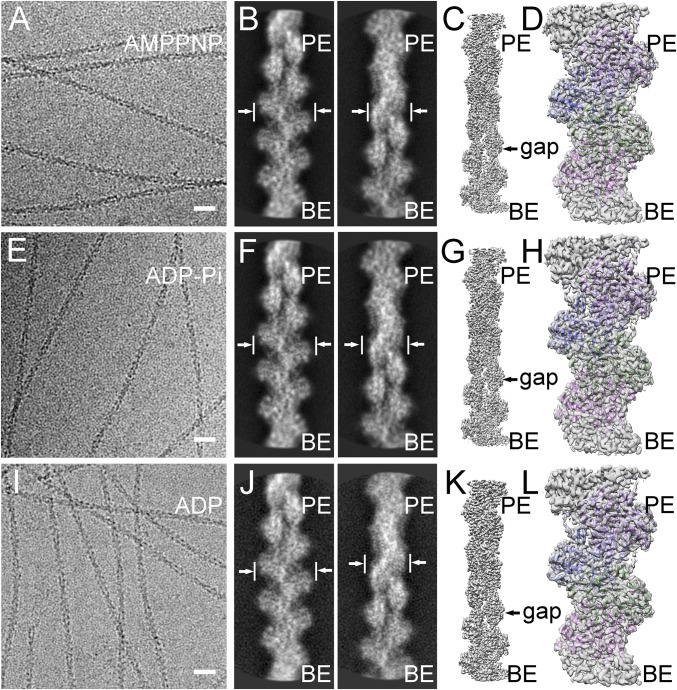
Fig. 1.
Helical reconstructions of actin filaments from low-dose electron cryo-micrographs. (A–D) AMPPNP-actin filaments reconstructed at 3.1 Å resolution. (E–H) ADP-Pi-actin filaments reconstructed at 3.1 Å resolution. (I–L) ADP-actin filaments reconstructed at 3.6 Å resolution. The maps are contoured at 0.020 V. The pointed ends (PE; top) and barbed end (BE; bottom) are labeled. (A, E, and I) Representative images. (Scale bas: 20 nm.) (B, F, and J) Pairs of contrast-inverted 2D class averages showing the wide (9 nm) and narrow (6 nm) projections of filaments. (C, G, and K) Three-dimensional reconstructions. (D, H, and L) Models fit into the density maps with the chain in each subunit colored differently.

