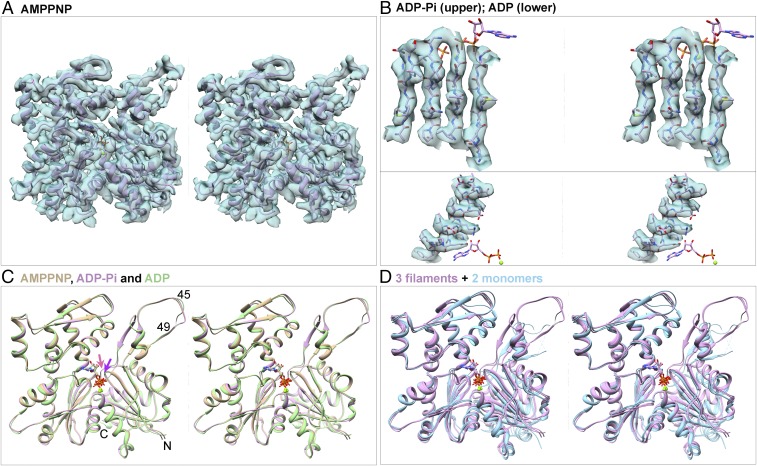
Fig. 2.
Stereoviews of models of actin filament subunits and actin monomers and of EM densities of actin filament subunits contoured at the same levels as Fig. 1. (A) Map and ribbon diagram of one subunit from the AMPPNP-actin filament. (B) Maps and stick figure models show densities for the side chains of β-strands from the ADP-Pi-actin filament (Upper) and an α-helix from the ADP-actin filament (Lower). The stick models of the nucleotides are for orientation. (C) Superimposed ribbon diagrams of subunits from the AMPPNP-actin (tan), ADP-Pi-actin (plum), and ADP-actin (green) filaments show that their backbones are nearly identical, except P1 loop (purple arrow) and sensor loop (salmon arrow). (D) Three ribbon diagrams from C are superimposed on ribbon diagrams of actin monomers (light blue) with bound Mg-ATP (PDB ID code 1NM1) or Mg-ADP (PDB ID code 3A5L) to show differences between filament subunits and monomers. Structures in C and D are aligned using subdomain 3.

