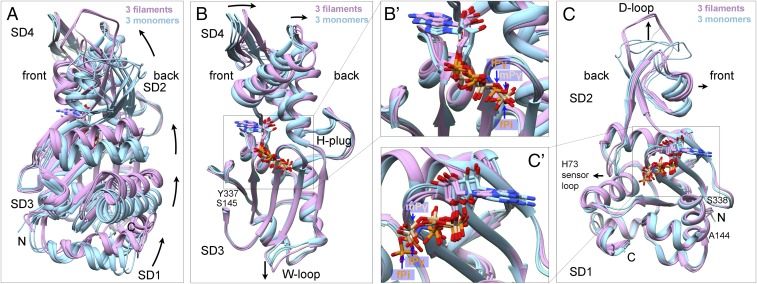
Fig. 3.
Ribbon diagrams showing interdomain rotation and intersubdomain (SD) bending upon filament formation. Light blue shows three actin monomer crystal structures in the closed conformation: rabbit skeletal muscle Ca-ATP-actin complexed with DNase I (PDB ID code 2A42), Dictyostelium Mg-ADP-actin complexed with human gelsolin segment 1 (PDB ID code 3A5L), and budding yeast Mg-ATP-actin complexed with human gelsolin segment 1 (PDB ID code 1YAG). Plum shows our three EM structures of actin filaments. Nucleotides are shown as stick figures with phosphorus atoms orange in filaments and tan in monomers. Arrows mark differences between monomers and filaments. (A) Dihedral angle-like interdomain rotation. The six molecules are aligned using subdomains 3 and 4 (residues 145–337). (B) Bending of subdomain 4 (181–269) relative to subdomain 3 (residues 145–180 and 270–337). The molecules are aligned using subdomain 3. Inset B′ shows the phosphates in monomers and filaments. (C) Bending of subdomain 2 relative to subdomain 1. The molecules are aligned using subdomain 1 (residues 5–32, 70–144, and 338–370). Inset C′ shows the phosphates in monomers and filaments.

