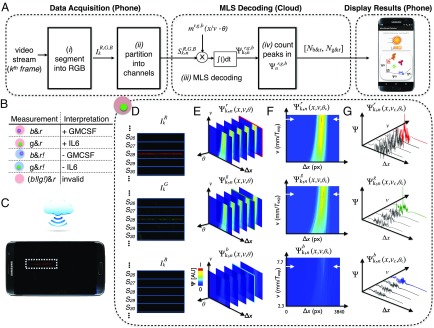
Fig. 3.
Software workflow for phase and velocity invariant optofluidic fluorescence droplet detection. (A) The algorithm for detecting droplets. (B) Truth table for interpreting the readout of the MD’s three-color (r, red ELISA signal; g, green beads; b, blue beads) fluorescence measurement. (C) Schematic showing the MD platform collecting data, which are sent to the cloud to be processed, and then returned to the mobile phone to report the results of the assay to the user. (D–F) A sample workflow for a droplet that contains a green bead and is positive for its target. (D) The video’s image frames are segmented into 1D vectors. (E) A 3D correlation results in a data matrix where the phase is first identified. (F) From this 2D “slice” of the data matrix, the velocity of the droplet is found. (G) The position is recorded for each peak in the correlation space.

