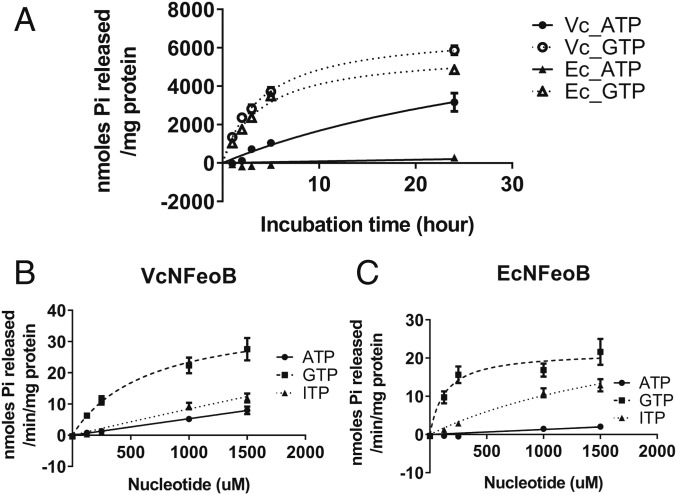
Fig. 2.
NTPase activity of V. cholerae and E. coli NFeoB. (A) Incubation of VcNFeoB with 1,000 µM ATP or GTP shows hydrolysis of ATP (●) as well as GTP (○). EcNFeoB showed GTPase activity (Δ) but no significant ATPase activity (▲). (B and C) The reaction rates for VcNFeoB (B) and EcNFeoB (C) with ATP (●), ITP (▲), and GTP (■) as substrate were measured as described in Materials and Methods.

