Fig. 4.
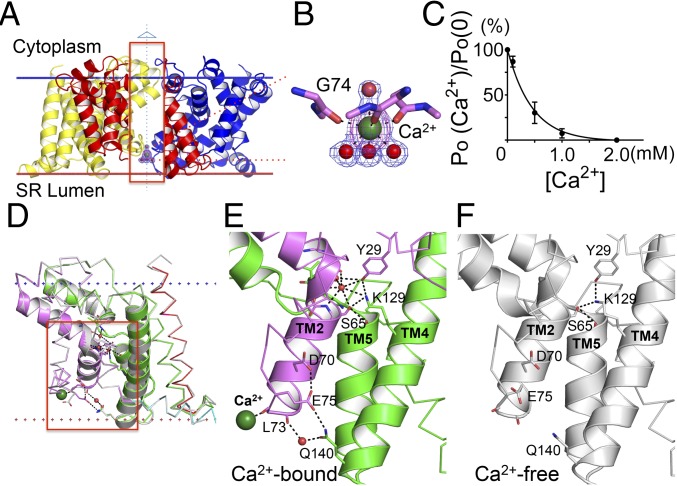
Calcium binding and modulation in TRIC channels. (A) Ribbon diagram of Ca2+ binding in the structure of GgTRIC-A, as viewed from membrane. To have a better view for the Ca2+ binding, a section of the front protomer (inside the red box) is removed. The bound Ca2+ ion (dark green) and water molecules (red) are shown as spheres. 2Fo-Fc electron density contours are shown for both water molecules and Ca2+ ion, contoured at 1.5σ and colored in blue. The anomalous density is also shown for Ca2+ ion, colored in purple and contoured at 5.0σ. (B) A close-up view of the Ca2+ binding to the backbone carbonyl oxygen atom of G74. Water molecules and Ca2+ ion are shown, as in A. G74 O to Ca2+, distance = 2.4 Å; Ca2+ to water molecules, distance = 2.5 Å (lower) or 2.6 Å (upper). (C) GgTRIC-A channel modulation by luminal Ca2+. Relative channel open probabilities (PO) were determined from planar lipid bilayer recordings at +50 mV voltages (200 mM KCl in both trans and cis solutions) in the presence of varied Ca2+ concentrations in the cis side (n = 3). (D) Superimposition of GgTRIC-A, the Ca2+-bound structure vs. the Ca2+-free structure. The residues involved in hydrogen bonding interactions are shown as sticks. The hydrogen bonds (distance <3.2 Å) are indicated as a black dashed line. Water molecules involved in interaction are shown as red spheres. Ca2+ ion is shown as a sphere colored dark green. (E and F) Close-up views of hydrogen bonding interactions in Ca2+-bound GgTRIC-A (E) and Ca2+-free GgTRIC-A (F).

