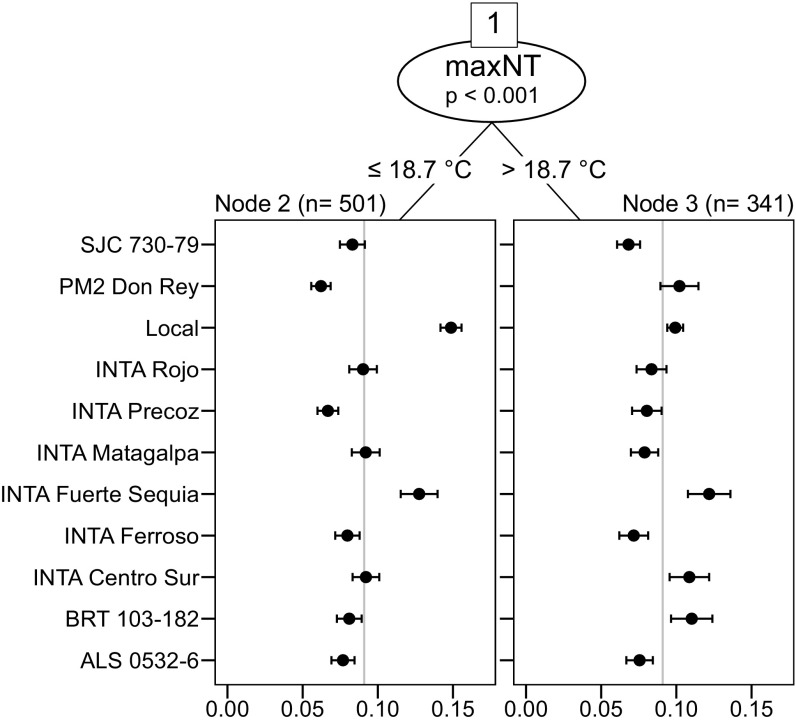
Fig. 2.
Plackett–Luce trees of tricot trial data and associated climatic data for common bean in Nicaragua. The horizontal axis of each panel is the probability of winning of varieties. Error bars show quasi-SEs. The gray vertical lines indicate the average probability of winning (1/number of varieties). In this case, the model selected maxNT, the maximum night temperature (degrees Celsius) during the vegetative and flowering periods, as the covariate. Equivalent figures for the trials in Ethiopia and India are shown in SI Appendix, Figs. S2 and S3.

