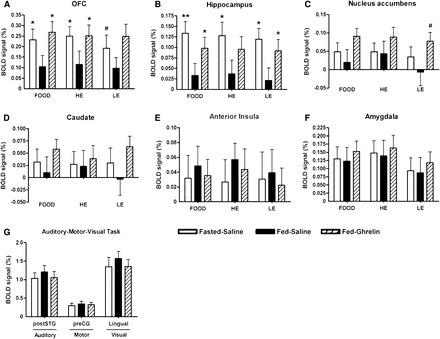
FIGURE 3.

Mean (±SEM) group activation of brain-reward systems to food pictures and auditory, motor, and visual cortex during a control task at study visits. Magnitude of group activation (percentage of BOLD signal change) for FOOD, HE, or LE minus object picture contrast at Fasted-Saline, Fed-Saline, and Fed-Ghrelin visits in the bilateral OFC (A), hippocampus (B), nucleus accumbens (C), caudate (D), anterior insula (E), and amygdala (F). Magnitude of group activation to a control auditory task (listening to a story) in the bilateral postSTG, motor task (button press) in the left preCG, and visual task (flashing checkerboard) in the lingual gyrus (G). n = 21 (both sexes). #P = 0.08–0.09, *P < 0.05, **P< 0.005 compared with Fed-Saline by using a 1-factor repeated-measures ANOVA with the post hoc Student Newman-Keuls test. Fasted-Saline, 16-h overnight fast and given subcutaneous saline injection; Fed-Ghrelin, given breakfast and subcutaneous ghrelin injection; Fed-Saline, given breakfast and subcutaneous saline injection; FOOD, high- or low-energy foods; HE, high-energy foods; LE, low-energy foods; OFC, orbitofrontal cortex; postSTG, posterior division of the superior temporal gyrus; preCG, precentral gyrus.
