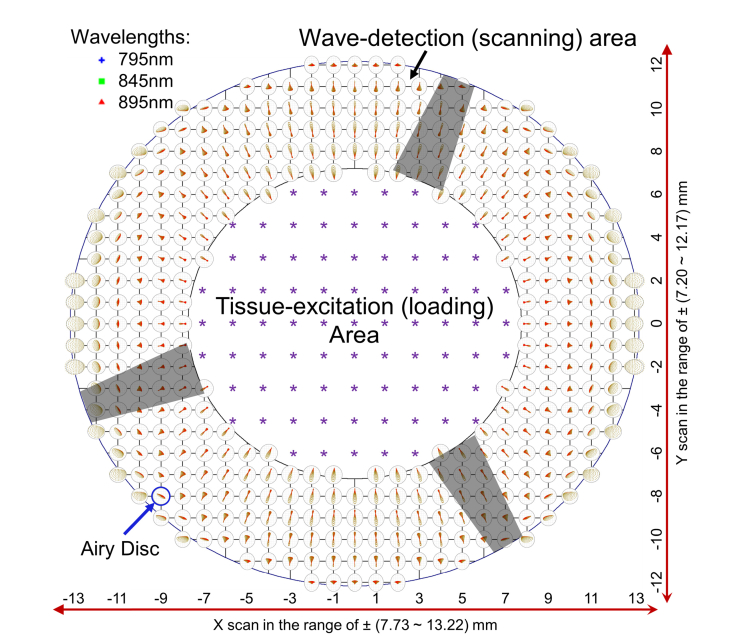
Fig. 9.
Demonstration of the tissue-excitation (loading) and the wave-detection (scanning) areas, as well as the spot diagrams at the focal plane, simulated in Zemax. The purple stars show the possible loading locations. The distance between two spots is 1mm in the x and y directions. The shadow areas are due to the obscuration of the Mirror 1 mount.

