Figure 4.
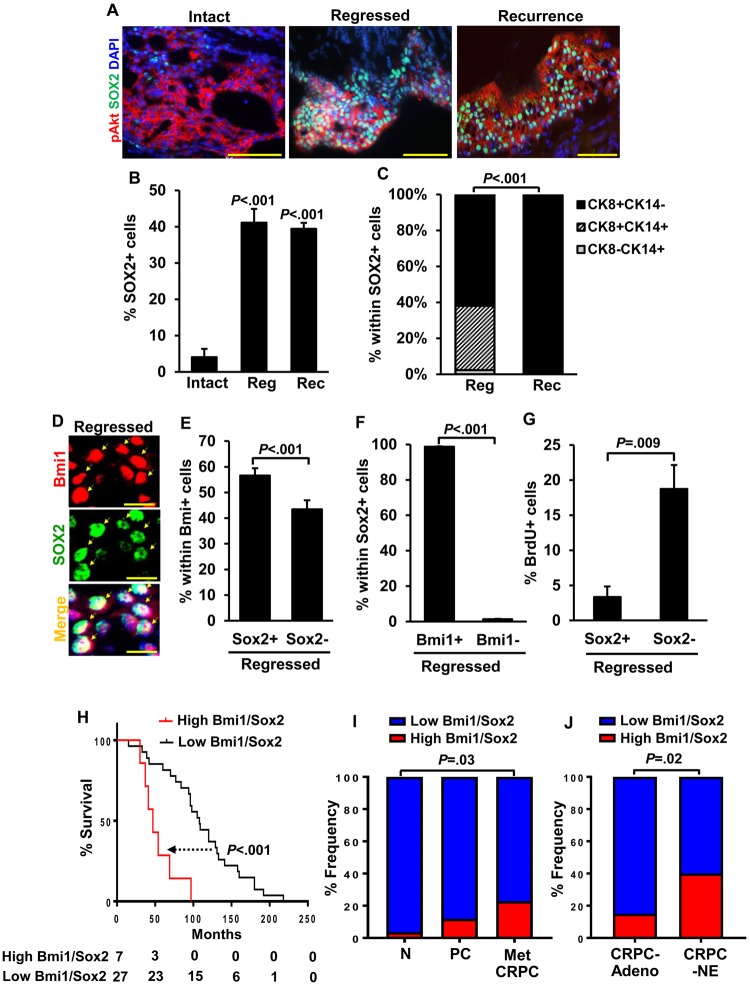
Analysis of castration-resistant Bmi1+Sox2+ cells in regressed BC-Pten tumor lesions. A) Representative images of Sox2+ cells in p-Akt+ lesions of intact, regressed, and recurrent tumors of prostate grafts. Scale bar, 50 μm. B) Quantitation of Sox2+ cells from A. C) Each distribution of CK8+ luminal cells, CK8+CK14+intermediate cells, and CK14+ basal cells within Sox2+ tumor cells. D) Coexpression of Sox2 with Bmi1 in the regressed tumors of prostate grafts. Arrows indicate Sox2+ cells that are positive for Bmi1. Scale bar, 10 μm. E) Percentage of Sox2+ cells within Bmi1+ cells from “D”. F and G) Graphs showed that most of Sox2+ cells coexpressed with Bmi1 (98.7% from 8 grafts, F) and have low BrdU incorporation rate (G). B–G) Data represent the mean ± SD, two-sided Student t test. H) Survival analysis of a cohort of metastatic CRPC patients pretreated with hormone therapy shows that the patients with high expression in both Bmi1 and Sox2 (high Bmi1/Sox2, n = 7) have poorer prognosis than patients with low expression in both genes (low Bmi1/Sox2, n = 27). Data for this analysis were used from the Grasso prostate cancer dataset (NCBI GEO Database #: GSE35988) (18). P values were determined by log-rank test. I) Frequency of cases with high Bmi1/Sox2 expression in benign prostate tissues (N, n = 28), localized primary cancers (PC, n = 59), and metastatic CRPC (Met CRPC, n = 35) from the Grasso prostate cancer dataset. J) Comparision of the cases with high Bmi1/Sox2 expression in CRPC with adenocarcinoma (CRPC-Adeno, n = 40) and CRPC with neuroendocrine (CRPC-NE, n = 25) from the Beltran dataset (19). Cut-off values for every analysis were determined by the median both Bmi1 and Sox2 mRNA expression value. χ2 test. CRPC: castration-resistant prostate cancer.

