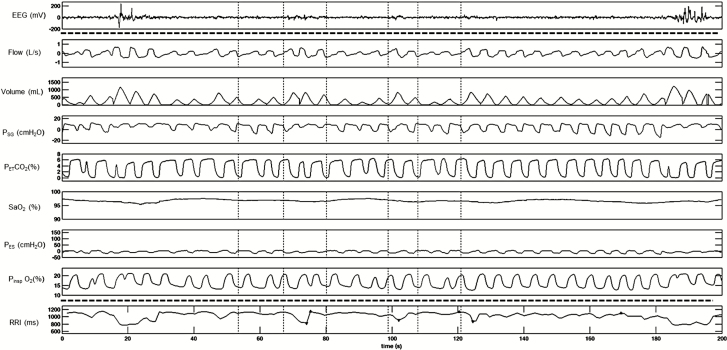
Figure 2.
A representative polygraph record of respiratory event (RE) without significant desaturation or cortical arousals (top part). Note the responses in heart rate and RRI following each RE (bottom part). RRI tracing was retro-graphed from exported signal that calculates RRI from raw electrocardiograph (ECG) recording. EEG and RRI tracings (top and bottom segments separated by dotted line) were recorded in different systems and time matched with the respiratory tracing. EEG = electroencephalogram; PSG = supraglottic pressure; PETCO2 = end-tidal CO2; SaO2 = oxygen saturation; PES = esophageal pressure; PIO2 = inspired O2; RRI = R-R intervals.

