Figure 5.
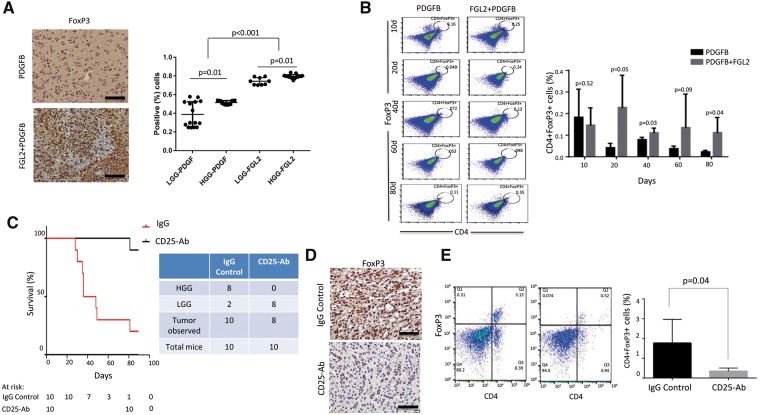
The influence of fibrinogen-like protein 2 (FGL2) expression on the recruitment of immune cells to the tumor microenvironment. A) Forkhead box P3 (FoxP3) expression in replication-competent ASLV long terminal repeat with a splice (RCAS) platelet-derived growth factor subunit B (PDGFB) and RCAS-PDGFB+FGL2 tumors. Scatter plot demonstrating the difference in FoxP3 expression between the two groups (magnification, 400×; scale bar = 50 μm) among LGGs and HGGs from each injection set. B) Immunosuppressive CD4+FoxP3+ cells in the tumor microenvironment were analyzed by fluorescence-activated cell sorting at different time points (10, 20, 40, 60, and 80 days). Data are presented as the mean ± standard deviation (n = 5 mice). An unpaired t test was used to calculate the two-sided P values. C) Kaplan-Meier curve demonstrating symptom-free survival in Ntv-a mice injected with replication-competent ASLV long terminal repeat with a splice (RCAS) platelet-derived growth factor subunit B (PDGFB)+FGL2 and treated with anti-CD25 antibody or rat immunoglobulin G (IgG) control starting three weeks after inoculation (n = 10 mice). D) Immunohistochemical staining of FoxP3 expression between treated and control groups (magnification, 400×; scale bar = 50 μm). E) Flow analysis of the depletion of CD4+FoxP3+ cells in the CD25 antibody–treated tumor compared with IgG control tumors (n = 5 mice). An unpaired t test was used to calculate the two-sided P values. FGL2 = fibrinogen-like protein 2; HGG = high-grade glioma; LGG = low-grade glioma; PDGF = platelet-derived growth factor; PDGFB = platelet-derived growth factor subunit B.

