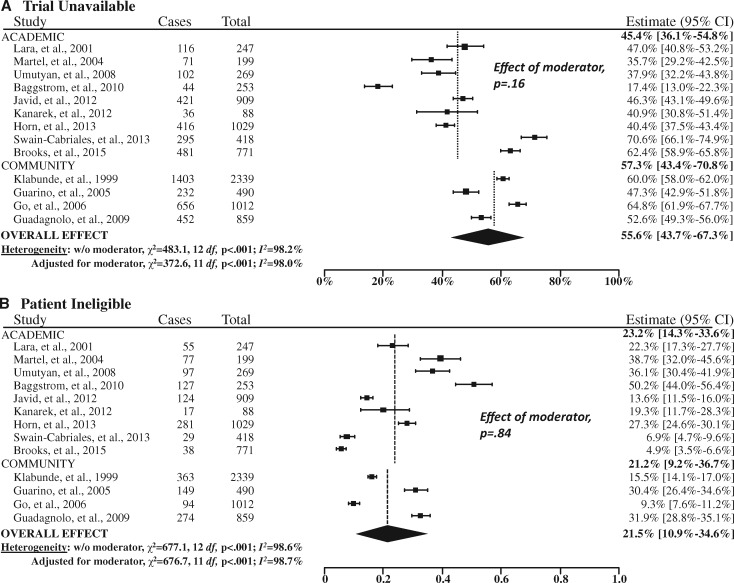
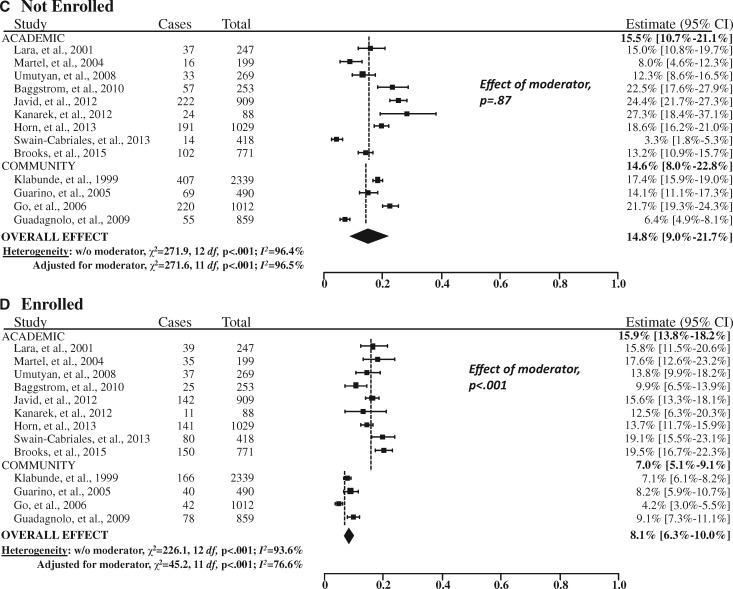
Figure 3.
Forest plots of the study-level and summary estimates for each domain. A) Trial unavailable. B) Patient ineligible. C) Not enrolled. D) Enrolled. The boxes show the study-level estimate and the 95% confidence intervals. The overall effect is a summary measure based on the meta-regression analysis accounting for institutional setting (academic vs community sites) as a moderator, weighted at a ratio of 15:85 based on the estimated proportion of cancer cases treated in the community setting (85%). The diamond shows the 95% confidence intervals (CIs) for the summary estimates. The P values were calculated from Cochran’s Q test; all statistical tests were two-sided. The dashed vertical lines indicate the derived estimate within academic and community sites, respectively.


