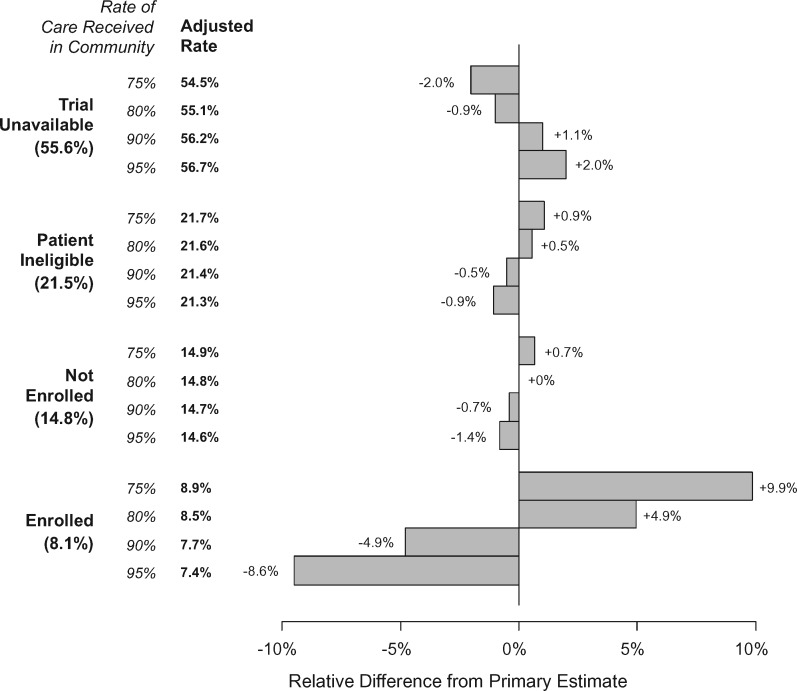
Figure 6.
Sensitivity of results to the assumed rate of care received in the community. For each domain, we allowed the assumed rate of care in the community to vary from 65% to 85% (with 75% not shown in the bar graph because this represents the primary baseline against which the alternative estimates are compared). The adjusted percentage rate is shown as well as the relative difference in the estimates in the bar graph.

