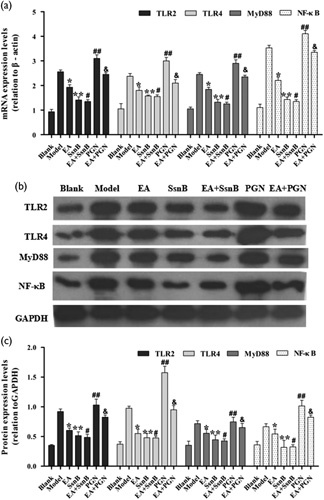
Fig. 2.

mRNA and protein expression levels of TLR2, MyD88 and NF-κB in each group. (a) Relative mRNA expression levels of TLR2, TLR4, MyD88 and NF-κB by RT-PCR. (b) Western blot detected the expression of TLR2, TLR4, MyD88 and NF-κB. (c) Photoshop CS5 software analysis of the protein expression levels (relation to GAPDH). The data are presented as mean±SD (n=10). Each bar represents the mean of three independent experiments performed in triplicate. *P<0.05, **P<0.05 and ##P<0.05 compared with the model group, #P>0.05 compared with the SsnB group. &P<0.05 compared with the PGN group. EA, electroacupuncture; PGN, peptidoglycan; SsnB, sparstolonin B; TLR, toll-like receptor.
