Figure 5.
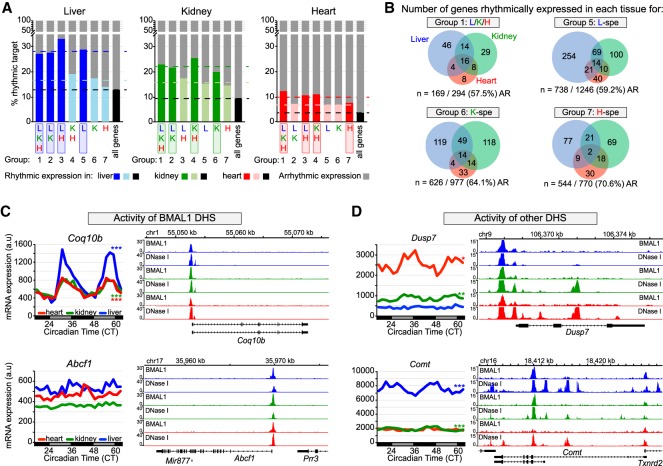
Transcriptional activities of BMAL1 DHS and other DHS contribute to BMAL1-mediated rhythmic transcription. (A) Percentage of rhythmically expressed gene for the seven groups of BMAL1-binding sites. Gene expression data originate from public microarray data sets (Zhang et al. 2014) and is considered rhythmic if q-value was <0.05 using JTK-cycle. (B) Overlap of rhythmic expression for peaks common to all three tissues (group 1), and for liver-, kidney-, and heart-specific BMAL1 peaks (groups 5, 6, and 7, respectively). The number of genes that are rhythmically expressed for the mouse liver (blue), kidney (green), and heart (red) is displayed, along with the number and percentage of nonrhythmically expressed genes (AR). (C,D) mRNA expression (left) and genome browser view (right) of BMAL1 ChIP-seq and DNase-seq signals in the mouse liver (blue), kidney (green), and heart (red). Rhythmic expression determined by JTK cycle is defined as three asterisks if q-value was <0.001, two asterisks if q-value was <0.01, and one asterisk if q-value was <0.05. The genes Coq10b and Abcf1 (C) represent two examples for which the activity of BMAL1 DHS likely contributes to the differences in mRNA expression, where the genes Dusp7 and Comt (D) represent two examples for which the activity of other DHS likely contributes to BMAL1-mediated rhythmic transcription.

