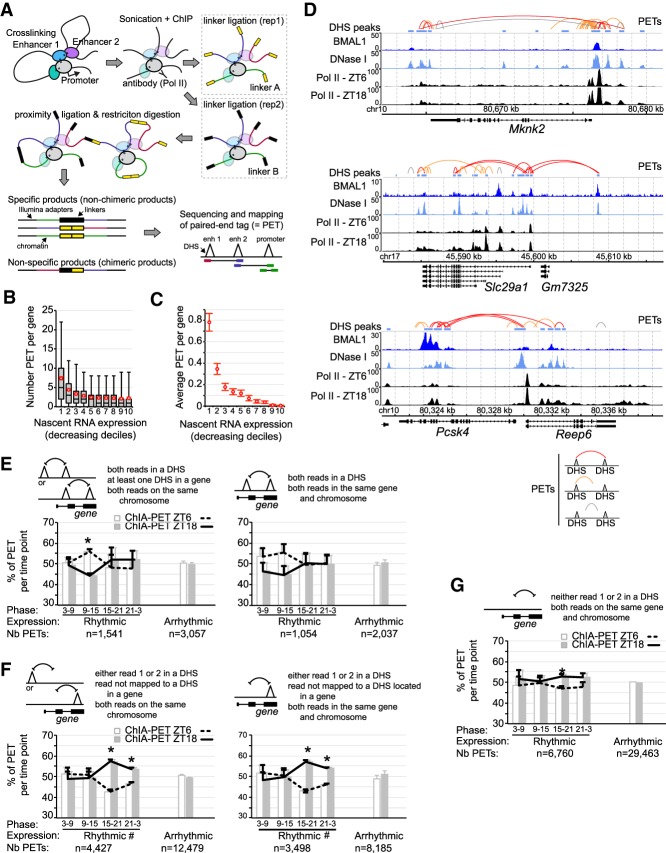
Figure 6.
Analysis of chromatin interactions by RNA Pol II ChIA-PET in the mouse liver. (A) Illustration of the ChIA-PET technique. (B) Number of PETs with both reads mapped to the same gene and parsed based on gene nascent RNA expression in the mouse liver. Red circles represent the average PET number for each decile ±95% confidence intervals. (C) Average number of PETs per gene in the mouse liver with both reads located in different DHS and mapped to the same gene, parsed based on gene nascent RNA expression. Error bars represent the 95% confidence intervals. (D) Genome browser view of mouse liver BMAL1 ChIP-seq (this study), DNase-seq (ENCODE), and Pol II ChIP-seq (Sobel et al. 2017). PETs with both reads mapped to DHS are in red, while PETs with one read mapped to a DHS are in orange and those not mapped to a DHS are in gray. (E–G) Percentage of PETs detected at ZT6 (white bar and dashed black line) or ZT18 (gray bar and solid black line), displayed as the average ± S.E.M. of three independent experiments based on the type of PETs, the rhythmicity of gene expression, and the phase of expression. (*) P < 0.05 between ZT6 and ZT18; (#) an interaction found in the two-way ANOVA (P < 0.05) between the phase of expression and the time of the ChIA-PET experiment (ZT6 or ZT18). Triangles represent DHSs and may be located within a gene or not.

