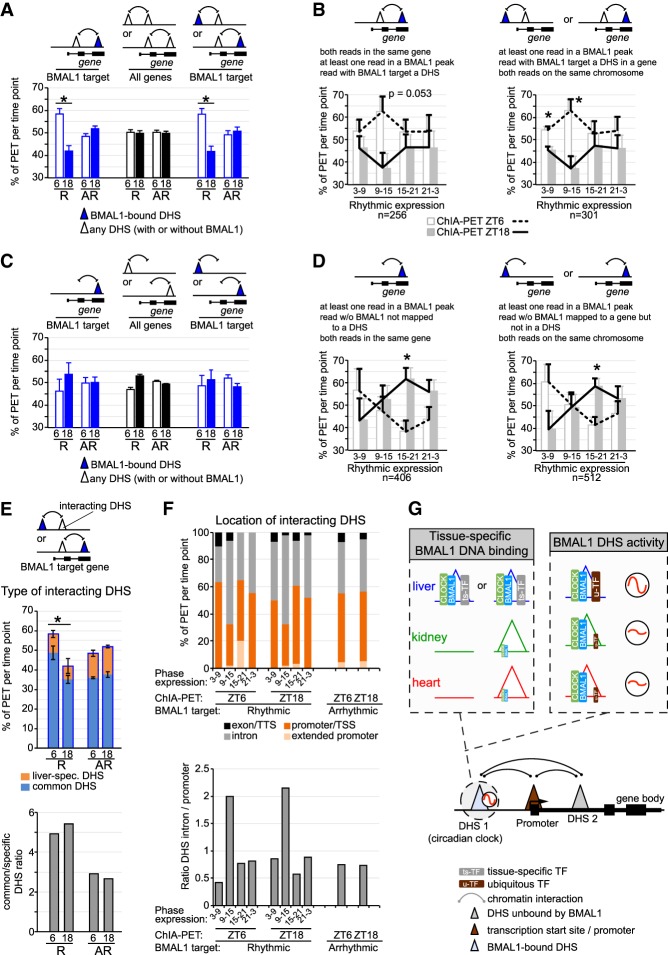
Figure 7.
Rhythmic chromatin interactions are more prevalent for rhythmically expressed genes. (A–D) Percentage of PETs detected at ZT6 (empty/white bar and dashed black line) or ZT18 (solid bar and solid black line) are displayed as the average ± S.E.M. of three independent experiments based on the type of PET, the rhythmicity of gene expression, the presence of a BMAL1-bound DHS, and the phase of gene expression. R = rhythmic expression; AR = arrhythmic expression. Triangles represent DHSs, and may be located within a gene or not. (*) P < 0.05 between ZT6 and ZT18. (E) Type of DHS (liver-specific DHS or DHS common to the liver, kidney, and heart) interacting with a BMAL1 DHS is displayed based on the transcriptional output of BMAL1 target genes (rhythmic or nonrhythmic) and the time at which the ChIA-PET experiment was performed (ZT6 or ZT18). Results are shown as percentage of PETs per ChIA-PET time point (as in A; top) or as the ratio of common DHS over liver-specific DHS (bottom). (F) Genomic location of DHSs interacting with BMAL1-bound DHS is displayed based on the transcriptional output of BMAL1 target genes (phase of expression, and rhythmic or nonrhythmic) and the time at which the ChIA-PET experiment was performed (ZT6 or ZT18). The locations of DHSs consist of exon and transcription termination site (TTS; in black), introns (in gray), promoter and TSS (−1 kb to +100 bp from TSS; in dark orange), and extended promoter (−10 kb to −1 kb from TSS; in light orange). (G) Hypothetical model illustrating how CLOCK:BMAL1 generates tissue-specific rhythmic transcriptional programs. This model incorporates mechanisms on how BMAL1 binds to DNA in a tissue-specific manner (chromatin accessibility and cobinding with ts-TFs) and how u-TFs might contribute to BMAL1 DHS rhythmic transcriptional activity. It also illustrates how functional interaction between BMAL1 DHSs and other DHSs (including tissue-specific DHS) may contribute to rhythmic transcription.

