Figure 1.
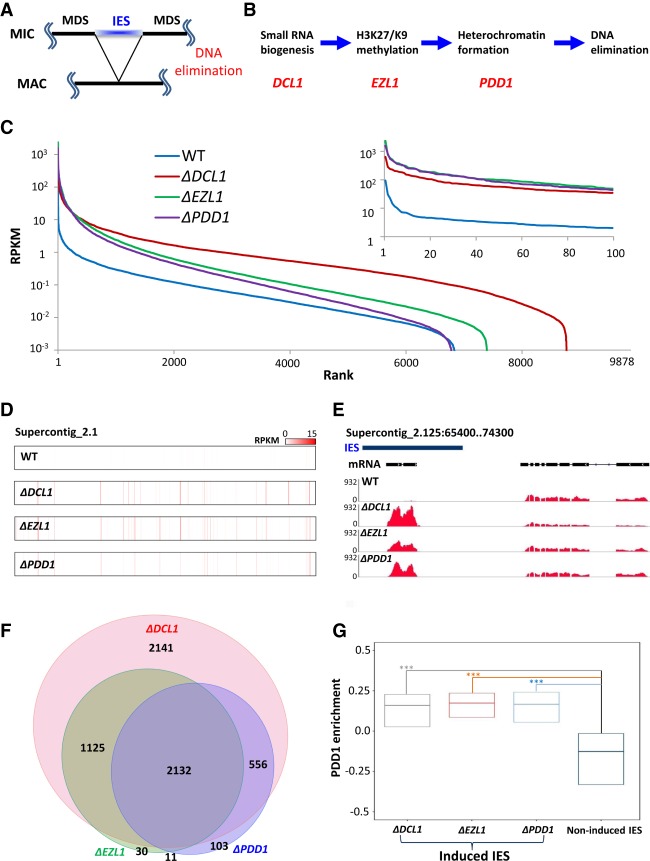
Widespread production of IES-specific polyadenylated transcripts in mutants deficient in RNAi-dependent Polycomb repression. (A) A schematic for DNA elimination in Tetrahymena. (B) Key steps and players in the DNA elimination pathway. (C) Distribution of polyadenylated transcripts in IESs. We ranked 9878 consistently processed IESs (Supplemental File S1) from highest to lowest by their coverage of polyadenylated RNA (reads per kilobase of transcript per million mapped reads [RPKM]), in wild type and mutants deficient in RNAi-dependent Polycomb repression (ΔDCL1, ΔEZL1, and ΔPDD1, respectively). (Inset) The top 100 IESs. Note increased and widespread transcription of IES-specific sequences in the mutants. (D) Distribution of highly expressed IESs, in wild type and the mutants. Supercontig 2.1, over 3.5 Mb in length, is analyzed. Read densities (RPKM) are represented by a color scale. Note the alignment of red stripes in the mutants, indicating coregulation by the RNAi-dependent Polycomb repression pathway. (E) A representative GBrowse view illustrating RNA sequencing (RNA-seq) coverage in wild type and the mutants. (Blue bar) IES. Gene model: an IES-specific (left) and an MDS-specific (right) gene. Note dramatically increased IES transcription in the mutants, compared with wild-type cells. (F) A proportional Venn diagram representing IESs highly induced in the mutants. (G) A box plot comparing PDD1 enrichment in wild-type cells [(ChIP − input)/(ChIP + input)] in IESs induced in the mutants (ΔDCL1, ΔEZL1, and ΔPDD1 cells, respectively) with IESs not induced in any mutants. The first quartile, median, and the third quartile are marked. A Kruskal-Wallis H test was performed for all three pairwise comparisons, revealing highly significant variances. P < 2.2 × 10⁻¹⁶.

