Figure 3.
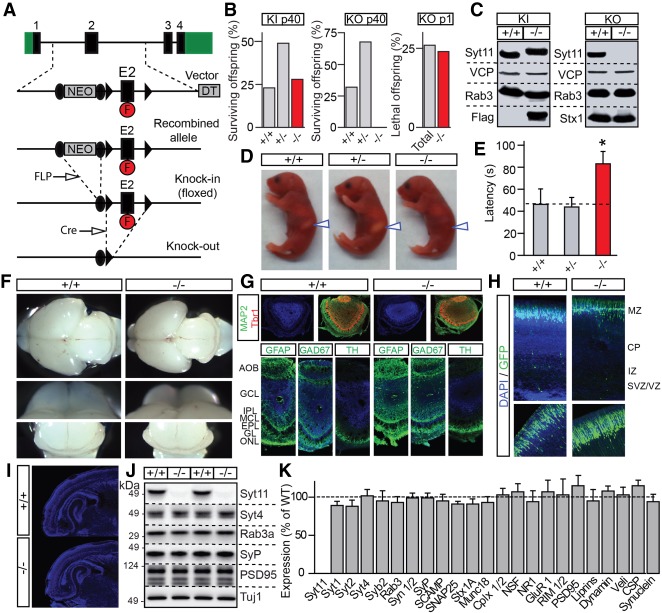
Generation and characterization of Syt11 knockout mice. (A) Schematics of gene targeting vector for homologous recombination. The second exon of Syt11 (E2) was flanked by loxP sites (black arrowheads) to allow conditional silencing. The NEO surrounded by FRT sites (black circles) and diphtheria toxin (DT) cassettes were used for positive and negative selection, respectively. The Flag epitope (F) was inserted into a coding region of E2. To obtain a floxed knock-in line (KI), mice carrying homologously recombined alleles were crossed with a transgenic line that express FLP recombinase. To obtain constitutive Syt11 knockouts (KO), knock-in founders were crossed with mice expressing Cre in the germline. (B) Percentages of surviving offspring of indicated ages and genotypes from breedings of heterozygote knock-in and knockout patents (n > 100 per line). (C) Total brain homogenates from postnatal day 1 (P1) wild-type and homozygous Syt11 knock-in and knockout mice were analyzed by immunoblotting with indicated antibodies. Note a shift in migration of Flag-tagged Syt11 in knock-ins and complete loss of the protein in knockouts. (D–K) Offspring of heterozygous Syt11 knockout parents were analyzed at P1. (D) Photographs of pups of indicated genotypes. Note the lack of milk in stomachs of homozygote knockouts (arrows). (E) Averaged latencies to suckle, as assessed in nine to 25 pups per genotype. (F) Representative images of whole brains, olfactory bulbs, and cerebella. (G) Coronal sections of olfactory bulbs were stained with DAPI and antibodies against MAP2, Tbr2, GFAP, GAD67, and TH. (H) Cortices of embryonic day 15.5 (E15.5) embryos were in utero electroporated with the plasmid that expresses GFP to assess neuron migration. Representative images of GFP fluorescence in DAPI-stained sections from three newborn mice/genotype are shown. (I) Low magnification images of DAPI-stained brain sections. (J,K) Expression levels of indicated proteins in the brain were analyzed by quantitative immunoblotting with I125-labeled secondary antibodies. Representative blots and averaged values from three littermate pairs of wild-type and constitutive knockout (−/−) mice are shown. All quantifications are represented as Mean ± SE (error bars). (*) P < 0.05, defined by Student's t-test.

