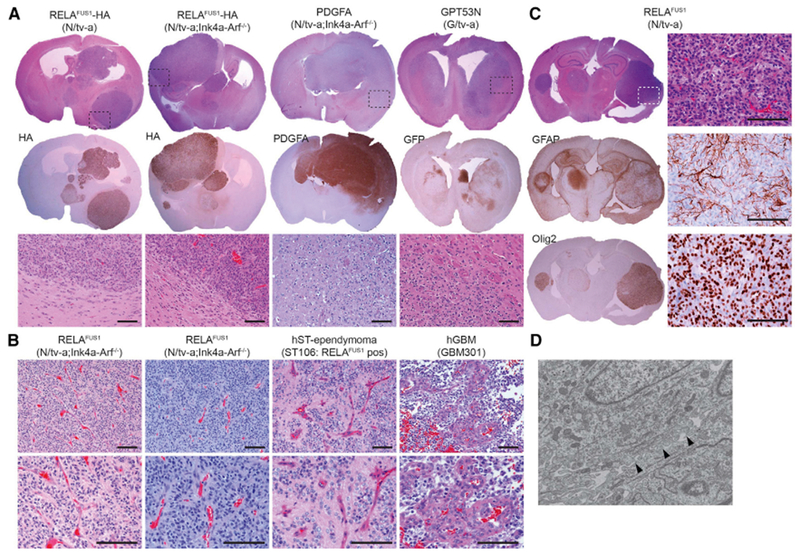
Figure 2. RELAFUS1-induced Mouse Tumors Recapitulate Human ST-EPN Histology.

(A) Representative H&E and immunohistochemistry (IHC) images of RCAS-RELAFUS1-HA-, PDGFA-, and GPT53N-induced brain tumors in the indicated tv-a mice. HA, PDGFA, and GFP antibody immunoexpression represents essentially the vector expression. Dashed boxes at the top denote the enlarged regions as shown at the bottom. Scale bars, 100 μm.
(B) Representative H&E stainings of RELAFUS1-induced brain tumors in N/tv-a;Ink4a-Arf−/− mice, human RELAFUS1-positive ST-ependymoma, and human GBM. Scale bars, 100 μm.
(C) Representative H&E and IHC analysis with the indicated antibodies of RCAS-RELAFUS1-induced brain tumors in N/tv-a mice. All enlarged images represent the areas of dashed boxes in H&E staining. Scale bars, 100 μm.
(D) Representative ultra-structure of a RELAFUS1-induced brain tumor. Black arrowheads show interdigitating tumor cell processes.
