
Figure 3. RELA Expression in Mouse and Human RELAFUS1 EPNs.
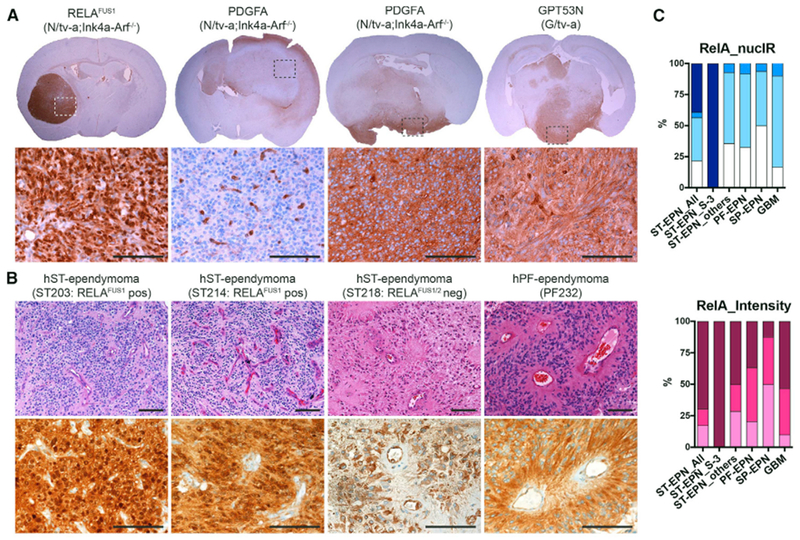
(A) Representative IHC analysis for RELA of RCAS-RELAFUS1-, PDGFA- and GPT53N-induced brain tumors in the indicated tv-a mice. Dashed boxes at the top denote the enlarged regions as shown at the bottom. Scale bars, 100 μm.
(B) Representative H&E and IHC analysis for RELA of human RELAFUS1-positive (ST203, ST214) and RELAFUS1/2-negative (ST218) ST-ependymomas and PF-EPN (PF232). All IHC images show the same area as each H&E images. Scale bars, 100 μm.
(C) Summary of semiquantitative immunohistochemical analysis for RELA in human ependymomas and GBMs. The immunoexpression level was evaluated using two criteria: nuclear immunoreactivity (NucIR) and staining intensity as described in Figure S3D and Table S2B. See also Supplemental Experimental Procedures.