
Figure 4. RELAFUS1-induced Mouse Tumors Express a Human ST-EPN-RELA-like Transcriptome.
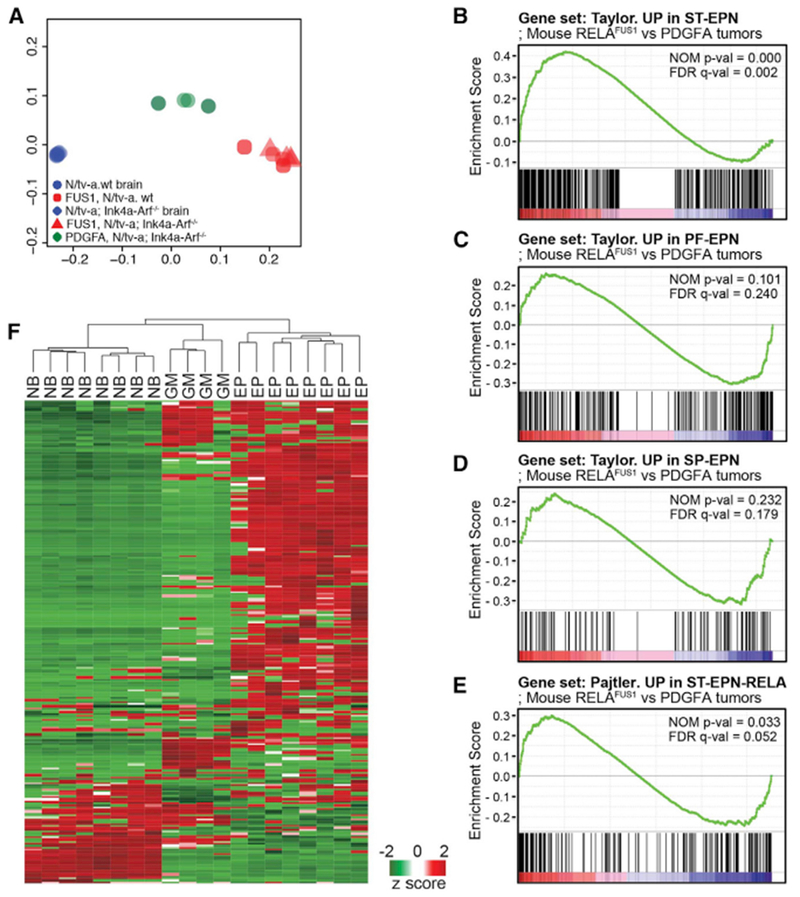
(A) Principal-component analysis with gene expression profiling of RELAFUS1 ependymomas, PDGFA-driven murine gliomas, and normal mouse brains.
(B–E) Gene set enrichment analysis (GSEA) of RELAFUS1 ependymomas and PDGFA-induced gliomas. Gene expression profiles were compared between both mouse tumor types using gene sets based on ST- (B), PF- (C), and SP-EPN (D) or ST-EPN-RELA’s (E) gene expression signatures (Pajtler et al., 2015; Taylor et al., 2005). The nominal p value (NOM p-val) and false discovery rate (FDR)-corrected q value (FDR q-val) are indicated. A nominal p value of <0.05 was considered significant in this analysis.
(F) Unsupervised hierarchical cluster analysis of 302 validated NF-κB target genes expressed de novo in mouse RELAFUS1-EPN (EP), PDGFA-driven glioma (GM), and normal mouse brain (NB) (http://www.bu.edu/nf-kb/gene-resources/target-genes/; T. D. Gilmore; Parker et al., 2014).