
Figure 5. Serine-486 of RELAFUS1 Is Critical to Drive Tumorigenesis.
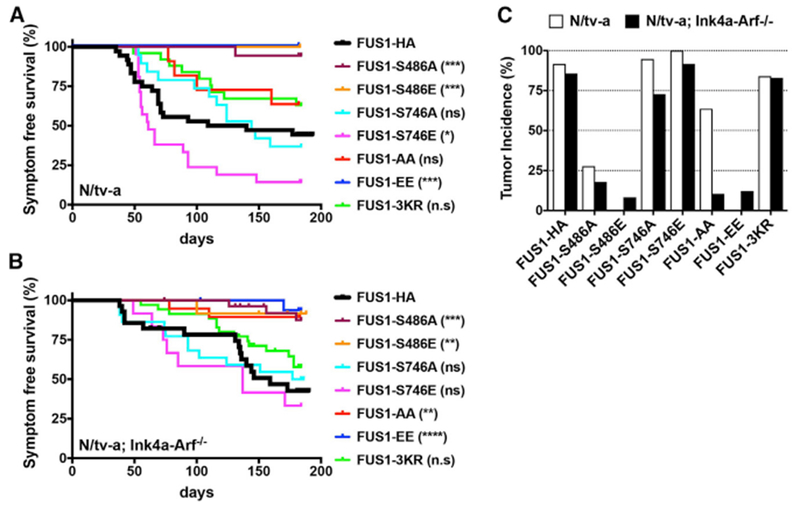
(A and B) Kaplan-Meier survival curves showing symptom-free survival of RELAFUS1-HA or RELAFUS1-HA mutant-induced brain tumors in N/tv-a (A) and N/tv-a; Ink4a-Arf−/− (B) mice. The survival curves of the RELAFUS1-HA-induced tumors from Figure 1B are also shown for comparison. Statistical comparison of each mutant with RELAFUS1-HA is also shown in the legends and Table S1C. *p < 0.05, **p < 0.01, ***p < 0.001, ****p < 0.0001.
(C) Tumor incidence of RELA-HA, RELAFUS1-HA, or the relevant mutant injection in N/tv-a and N/tv-a;Ink4a-Arf−/− mice. See also Tables S1A–S1C.