
Figure 6. RNA-Seq Analysis of NIH3T3T Cells and RELAFUS1-induced Mouse Tumors.
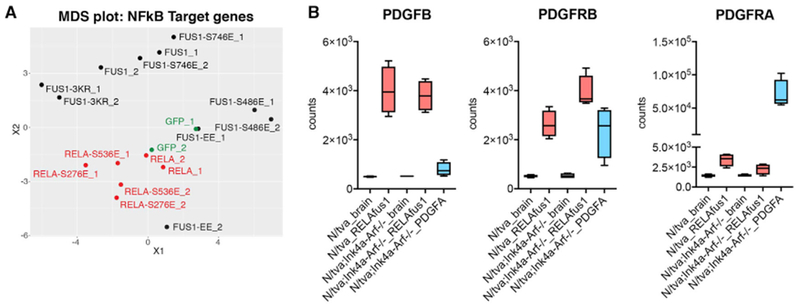
(A) Multidimensional scaling (MDS) projection of sample similarities based on gene expression profiling analyzed with the NF-κB gene set in NIH 3T3T cells infecting the indicated RCAS vectors. See also Tables S5, S6, and S7.
(B) Boxplots of PDGFB, PDGFRB, and PDGFRA expression in mouse brain and brain tumor tissues. See also Table S3.