
Figure 7. The Normal Ventricular Wall as the Putative Location for Ependymomagenesis.
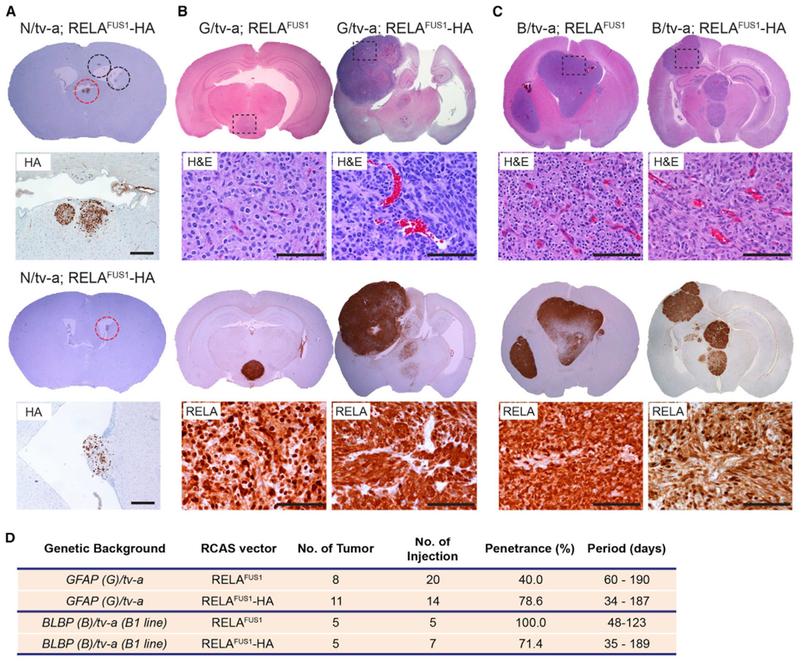
(A) Representative IHC images of the HA tag of RCAS-RELAFUS1-HA-induced brain tumors in N/tv-a mice (see also Figure S7E). Brain tumor formation was examined with HA tag staining 1 month post-injection. Dashed circles at the top show early lesions representing, essentially, RCAS vector expression. Red dashed circles denote the enlarged regions as shown at the bottom. Scale bars, 200 μm.
(B and C) Representative H&E and IHC images for RELA of RELAFUS1 or RELAFUS1-HA-induced brain tumors in GFAP(G)/tv-a (B) or BLBP(B)/tv-a mice (C). Enlarged areas for H&E and RELA are shown as a dashed box in each H&E brain. Scale bars, 100 μm.
(D) Summary of RCAS-RELAFUS1 or RELAFUS1-HA vector injections in G/tv-a or B/tv-a mice.