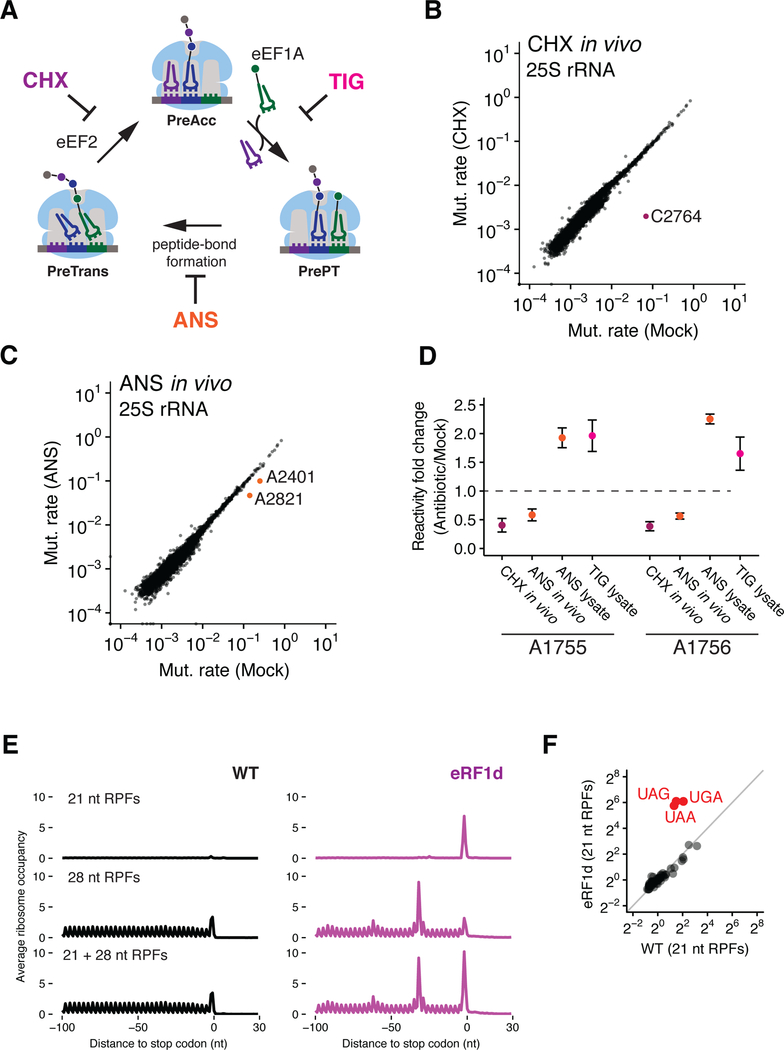
Figure 1. Assigning ribosome functional states to distinct footprint sizes (21 and 28 nt RPFs) from ribosome profiling samples.
(A) Schematic representation of the eukaryotic elongation cycle. PreAcc: pre-accommodation; PrePT: Pre-peptide bond formation; PreTrans: Pre-translocation. (B and C) Scatter plots showing mutation rates of 25S rRNA (a function of DMS reactivity) comparing CHX-pretreated (B) or ANS-pretreated (C) relative to mock pretreatment. Nucleotides protected by CHX or ANS are color-coded and labeled. (D) Fold change in mutation rates of nucleotides A1755 and A1756 for CHX-pretreatment with in vivo DMS modification (CHX in vivo), ANS-pretreatment with in vivo DMS modification (ANS in vivo), ANS-pretreatment with DMS modification in lysate (ANS lysate), and TIG with DMS modification in lysate (TIG lysate) (n=2, ±SD). (E) Average ribosome occupancies aligned at stop codons using 21 nt RPFs (top), 28 nt RPFs (middle) and both RPFs (bottom) for WT and eRF1-depleted (eRF1d) cells. (F) Scatter plot comparing 64 codon-specific ribosome occupancies (pause scores) for 21 nt RPFs in WT and eRF1d cells.

