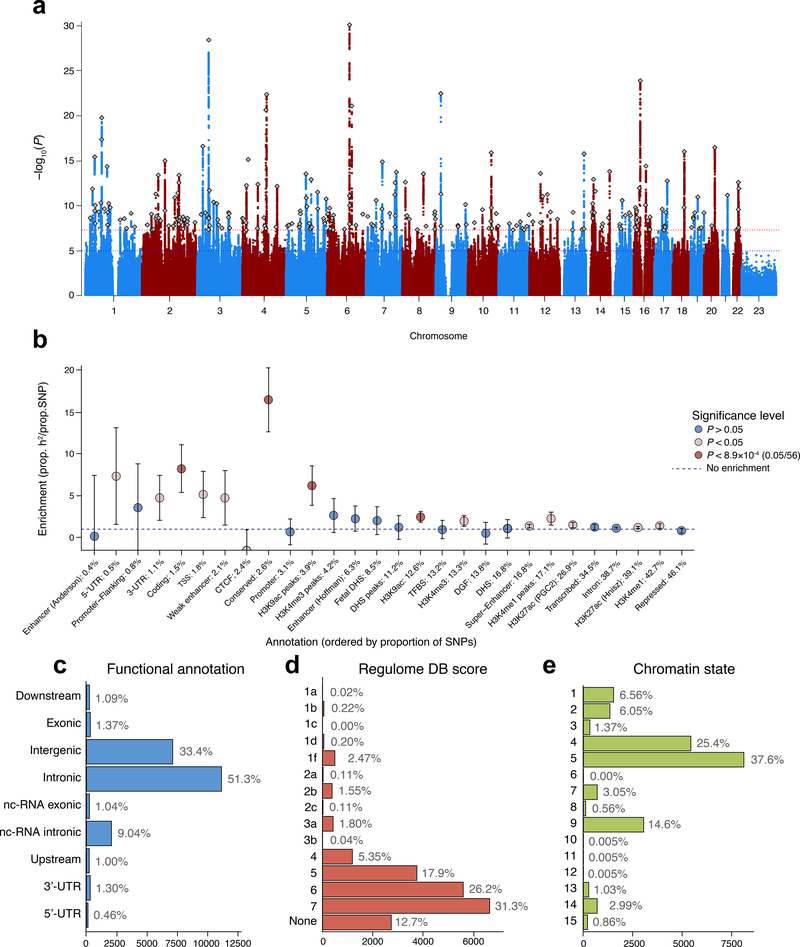
Figure 1. SNP-based associations with intelligence in the GWAS meta-analysis of N=269,867 independent individuals.
(a) Manhattan plot showing the −log10 transformed two-tailed P-value of each SNP from the GWAS meta-analysis (of linear and logistic regression statistics) on the y-axis and base pair positions along the chromosomes on the x-axis. The dotted red line indicates Bonferroni-corrected genome-wide significance (P<5×10⁻⁸); the blue line the threshold for suggestive associations (P<1×10⁻⁵). Independent lead SNPs are indicated by a diamond. (b) Heritability enrichment of 28 functional annotation categories for SNPs in the meta-analysis, calculated with stratified LD score regression. Error bars show 95% confidence intervals around the enrichment estimate. The dashed horizontal line indicates no enrichment of the annotation category. Red dots indicate significant Bonferroni-corrected two-tailed P-values and beige dots indicate suggestive (P<.05) values. UTR=untranslated region; TSS=transcription start site; CTCF=CCCTC-binding factor; DHS=DNaseI Hypersensitive Site; TFBS=transcription factor binding site; DGF=DNaseI digital genomic footprint. (c) Distribution of functional consequences of SNPs in genomic risk loci in the meta-analysis. (d) Distribution of RegulomeDB score for SNPs in genomic risk loci, with a low score indicating a higher likelihood of having a regulatory function (Online methods). (e) The minimum chromatin state across 127 tissue and cell types for SNPs in genomic risk loci, with lower states indicating higher accessibility and states 1–7 referring to open chromatin states (Online Methods).

