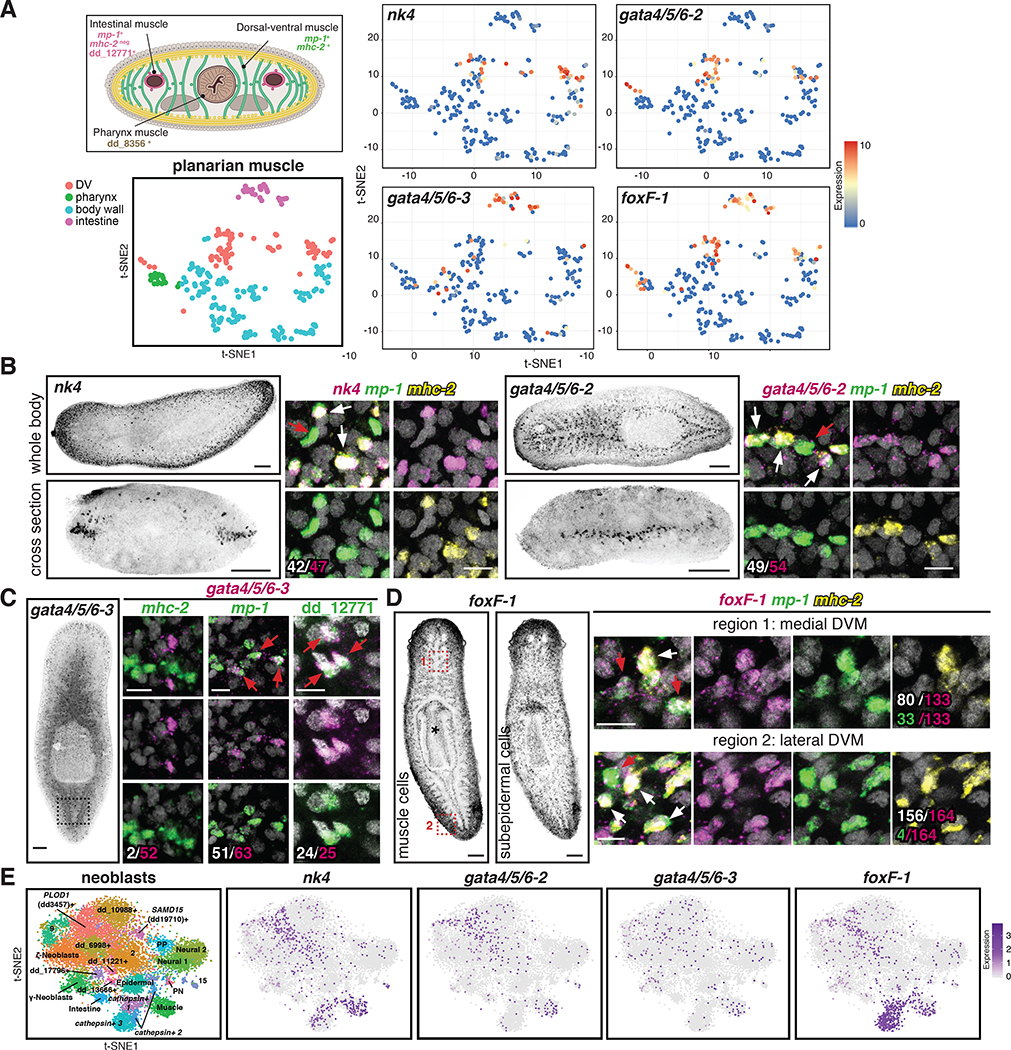
Figure 2. Conserved transcription factors are expressed in each muscle cluster.
(A) Top: Cross section diagram showing different muscle markers. Bottom: t-SNE representation of major planarian muscle classes. Right: t-SNE plots colored according to muscle-cluster TF gene expression. t-SNE plots: blue-to-red represents low-to-high expression (log2 CPM). (B) Left: nk4 (lateral DVM) and gata4/5/6–2 (medial DVM) expression patterns. Right: higher magnification of one confocal plane. White: number of TF+/ mp-1+/mhc-2+ cells out of total cells expressing the TF. (C) Left: gata4/5/6–3 (IM) expression. Right: higher magnification of one confocal plane showing gata4/5/6–3+/mhc-2-, mp-1+, and dd_12771(PTPRD)+ cells. White: number of muscle marker+/gata4/5/6–3+ out of total gata4/5/6–3+ cells. (D) Left: foxF-1 expression patterns. * pharynx muscle. Right: higher magnification of one confocal plane. White: number of mp-1+ mhc-2+foxF-1+ cells out of total foxF-1+ cells. Green: number of mp-1+/foxF-1+ cells out of total foxF-1+ cells. B-D: White arrows, DVM cells; red arrows, IM cells. (E) Left: t-SNE representation of subclusters from smedwi-1+ neoblasts [13]. Right: t-SNE plots showing nk4, gata4/5/6–2, gata4/5/6–3, and foxF-1 expression in neoblasts. Images are maximal intensity projections of the entire DV axis in B,C, or of planes around intestinal branches in D left. Bars: FISH panels, 100 μm; zoom in pictures, 10 μm. See also Figure S4; Table S2, and Data S1.

