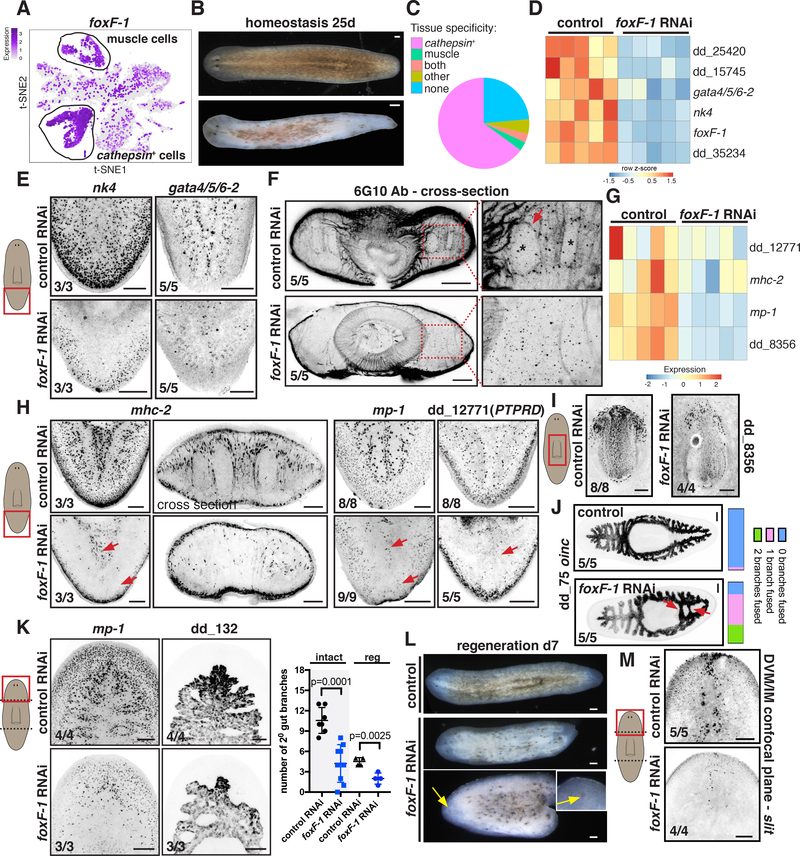
Figure 5. foxF-1 is required for the specification of all non-BWM in planarians.
(A). t-SNE plot: foxF-1 expression in muscle and non-muscle cathepsin+ cells. (B) Depigmentation of an uninjured foxF-1 RNAi animal. (C) Pie chart shows fraction of tissue-specific genes significantly downregulated (FDR < 0.05) in uninjured foxF-1 RNAi animals. (D) Heatmap of TF expression downregulation (FDR<0.001) in uninjured foxF-1 RNAi animals. Gene expression z-scores were calculated per row. (E) Reduced expression of nk4 and gata4/5/6–2 in uninjured foxF-1 RNAi animals. (F) Reduced DVM and IM fibers in an uninjured foxF-1 RNAi animal by immunostaining. (G, H) Reduced muscle-marker expression (red arrows) in uninjured foxF-1 RNAi animals (G) Heatmap, (H) FISH. (I) Reduced pharynx muscle numbers in a foxF-1 RNAi animal. (J) Abnormal intestinal structure in a foxF-1 RNAi animal (red arrows). Right: intestine-branch fusion quantification. (K) Left: Reduced mp-1+ cells and intestine-branching defects in regenerating foxF-1 RNAi animals. Right: secondary intestinal branch numbers in intact (tail region) and regenerating (head blastema) animals. Mean ± SD. Unpaired Student’s t-test. (L) Depigmentation and cyclopia (yellow arrows) of regenerating foxF-1 RNAi animals. (M) Reduced DVM cells expressing the PCG slit in a regenerating foxF-1 RNAi animal. Images are maximal intensity projections of planes around intestinal branches. Cartoons depict image location. Bars, 100 mm. See also Figure S7 and Data S2.

