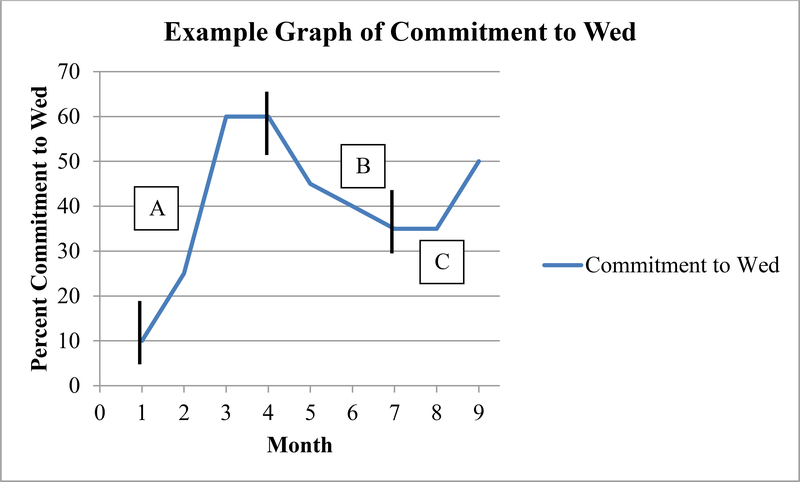
Figure 1.
Portrayal of a hypothetical commitment to wed graph. Path A reflects stability with increasing and stable levels of commitment to wed. Path B reflects declining commitment with a pattern of declining commitment to wed that lasts over a month. Path C reflects the end of declining commitment with stability and increasing commitment to wed (post-declining commitment; not examined in this study).

