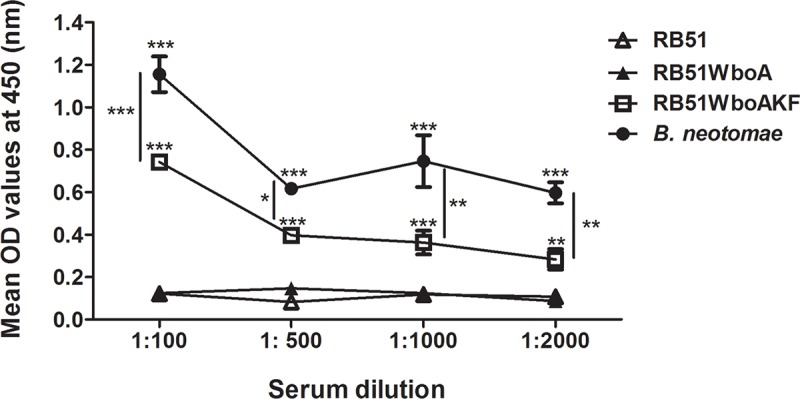
Fig 4. ELISA detection of O-polysaccharide expression on the cell surface of strain RB51WboAKF.

RB51, RB51WboA, RB51WboAKF and B. neotomae whole cells (108 CFU/well) were reacted with specific dilutions of anti-B. neotomae LPS antibody. The results are shown as mean ± standard deviation (n = 2) of the optical density (OD) at 450 nm of the color developed. Asterisks indicate statistically significant differences from strain RB51. *, P < 0.05; **, P < 0.01; ***, P < 0.001. OD, optical density.
