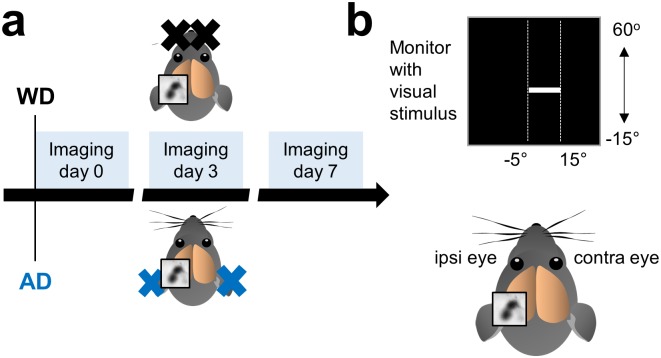
Fig 1. Experimental time course and schematic illustration of intrinsic signal imaging.
(a) In one group of mice we performed WD by bilaterally plucking all macro-vibrissae and in another group we induced AD by bilateral malleus removal. The first imaging session (day 0) for mapping V1 started immediately after the deprivation followed by a second imaging session at day 3 and a third imaging session at day 7. (b) For visual stimulation we used an upward or downward moving white light bar with 100% contrast which was presented in the right binocular visual field. We always recorded V1 responses in the left hemisphere. Thus, according to the position of the recorded hemisphere the left eye represents the ipsilateral and the right eye represents the contralateral eye.

