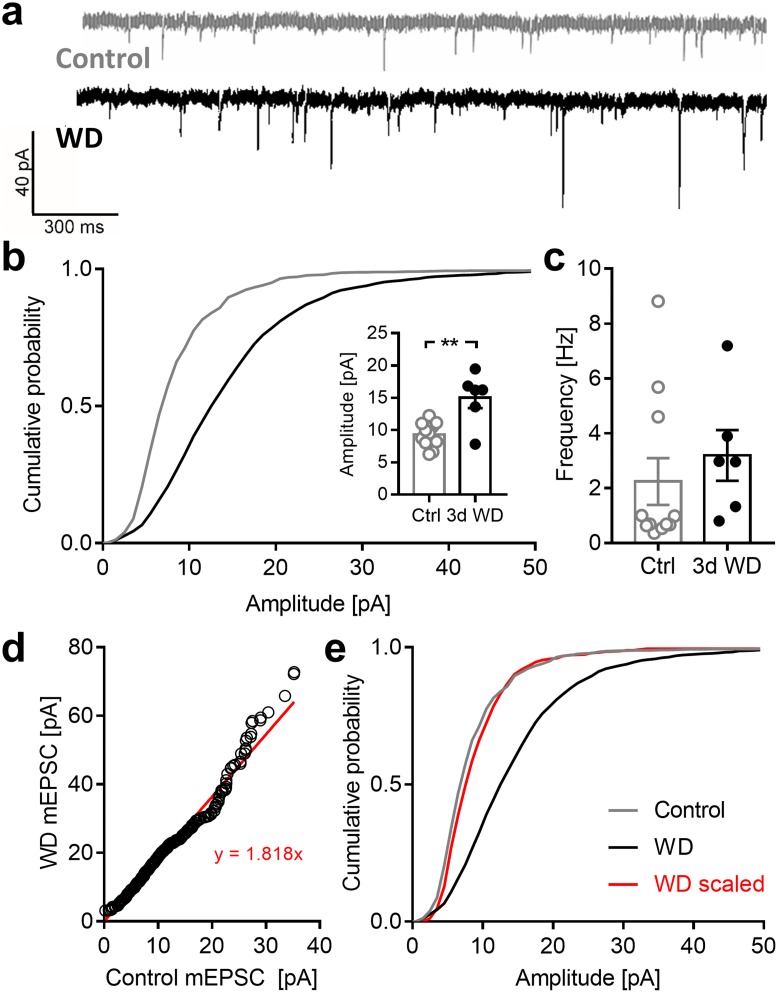
Fig 7. WD cross-modally increases mEPSC amplitudes in V1 layer 4.
(a) Representative traces of mEPSCs recorded in control mice (n = 4) and 3 d after WD (n = 3) (b) Cumulative distribution of all mEPSC amplitudes was right shifted in WD mice compared to control animals. Hence, the mean amplitude of mEPSCs was significantly increased in WD mice. These results suggest that WD induces synaptic plasticity in V1 layer 4. (c) Mean frequency of mEPSCs was unaltered after WD. (d) Plot of rank ordered mEPSC amplitudes from control and WD mice. The red line represents a linear regression of the data points. (e) Cumulative histograms of mEPSC amplitudes. Individual mEPSC amplitudes of WD mice were transformed with the equation y = 1.818x. The distribution of the transformed values is significantly different with the distribution of control values (Kolmogorov-Smirnov test). Bars represent means together with s.e.m., Open and filled circles represent measurements of individual animals; **p<0.01.

