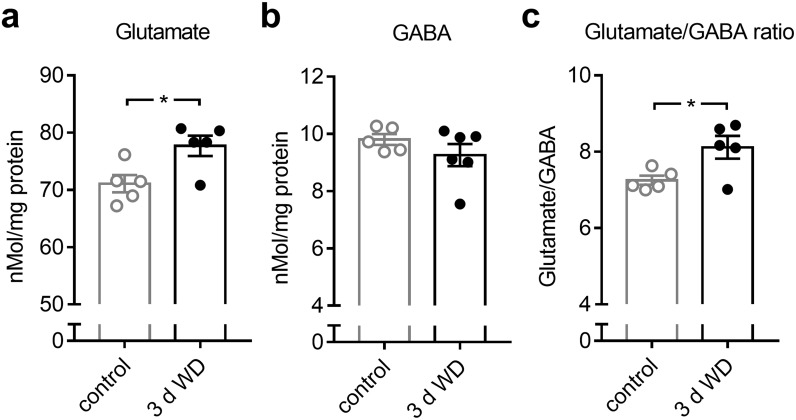
Fig 8. Concentration changes of neurotransmitters in V1 after WD revealed by post-mortem HPLC analyzes.
(a) Compared to the V1 glutamate level of control mice (n = 5), there was a significant increase of V1 glutamate content 3 days after WD (n = 5). (b) There was slight but not significant reduction of the V1 GABA concentration at 3 days after WD (n = 6) compared to controls. (c) The glutamate/GABA ratio was markedly increased at 3 after WD. Bars represent means together with s.e.m., Open and filled circles represent measurements of individual animals; *p<0.05.

